|
|
Contents
1.4 Contact Information for the Project
1.5 Summary of Construction Works
1.6 Summary of EM&A Programme Requirements
2 Environmental Monitoring and Auditing
2.4.2 Summary of Monitoring Results
2.4.3 Marine Sediment Management
2.5.2 Summary of Monitoring Results
2.5.3 Discussion on CWD Monitoring Results
2.5.4 Conclusions of CWD Monitoring Results
2.5.5 Site Audit for CWD-related Mitigation Measures
2.6.1 Brief Summary of the Agreed Method
2.6.2 Desk-Based Monitoring Result
2.7 Landscape and Visual Mitigation Measures
2.8 Environmental Site Inspection
2.9 Audit of the SkyPier High Speed Ferries
2.10 Audit of the Construction and Associated Vessels
2.11 External Stakeholder Engagement
2.11.1 Community Liaison Groups
2.11.2 Professional Liaison Group and Green Non-Governmental Organizations
2.12 Review of the Key Assumptions Adopted in the EIA Report
2.13 Key Environmental Issues for the Coming Reporting Period
3 Report on Non-compliance, Complaints, Notifications of Summons and Prosecutions
3.1 Compliance with Other Statutory Environmental Requirements
3.2 Analysis and Interpretation of Complaints, Notification of Summons and Status of Prosecutions
3.2.2 Notifications of Summons or Status of Prosecution
4 Conclusion and Recommendation
Tables
Table 1.1: Contact Information of Key Personnel
Table 1.2: Contact Information of the Project
Table 1.3: Summary of Status for All Environmental Aspects under the Manual 15
Table 2.1: Impact Air Quality Monitoring Stations
Table 2.2: Percentage of Air Quality Monitoring Results within Action and Limit Levels
Table 2.3: General Meteorological Condition during Impact Air Quality Monitoring
Table 2.4: Impact Noise Monitoring Stations
Table 2.5: Percentage of Noise Monitoring Results within Action and Limit Levels
Table 2.6: General Weather Condition during Impact Noise Monitoring
Table 2.7: Monitoring Locations and Parameters for Impact Water Quality Monitoring
Table 2.8: Action and Limit Levels for General Water Quality Monitoring and Regular DCM Monitoring
Table 2.10: General Weather Condition and Sea Condition during Impact Water Quality Monitoring
Table 2.11: Percentage of Water Quality Monitoring Results within Action and Limit Levels
Table 2.12: Action and Limit Levels for Construction Waste
Table 2.13: Statistics of Construction Waste Generated in the Reporting Period
Table 2.16: Land-based Survey Station Details
Table 2.17: Derived Values of Action Level and Limit Level for Chinese White Dolphin Monitoring
Table 2.18: Summary of daily average flow at Sewage Pumping Station 1 (SPS1)
Table 2.19: Monitoring Programme for Landscape and Visual
Table 2.20: Event and Action Plan for Landscape and Visual
Table 2.21: Landscape and Visual – Construction Phase Audit Summary
Table 2.23: Summary of the Tree Status Changes between end 2020 and end 2021
Table 2.24: Summary of the Transplanted Trees in the Reporting Period
Table 2.25: Photos of the Existing Transplanted Trees in the Reporting Period
Table 2.26: Summary of Key Audit Findings against the SkyPier Plan
Figures
Appendices
|
Environmental Mitigation Implementation Schedule (EMIS) for Construction Phase |
|
Abbreviations
|
3RS |
Three-Runway System |
|
AAHK |
Airport Authority Hong Kong |
|
AECOM |
AECOM Asia Company Limited |
|
AFCD |
Agriculture, Fisheries and Conservation Department |
|
AIS |
Automatic Information System |
|
ANI |
Encounter Rate of Number of Dolphins |
|
APM |
Automated People Mover |
|
AW |
Airport West |
|
BHS |
Baggage Handling System |
|
CAP |
Contamination Assessment Plan |
|
CAR |
Contamination Assessment Report |
|
CTP |
Coral Translocation Plan |
|
CWD |
Chinese White Dolphin |
|
DCM |
Deep Cement Mixing |
|
DEZ |
Dolphin Exclusion Zone |
|
DO |
Dissolved Oxygen |
|
DPSE |
Number of Dolphins per 100 Units of Survey Effort |
|
EAR |
Ecological Acoustic Recorder |
|
EIA |
Environmental Impact Assessment |
|
EM&A |
Environmental Monitoring & Audit |
|
EP |
Environmental Permit |
|
EPD |
Environmental Protection Department |
|
ET |
Environmental Team |
|
FCZ |
Fish Culture Zone |
|
HDD |
Horizontal Directional Drilling |
|
HKBCF |
Hong Kong-Zhuhai-Macao Bridge Hong Kong Boundary Crossing Facilities |
|
HKIA |
Hong Kong International Airport |
|
HSF |
High Speed Ferry |
|
IEC |
Independent Environmental Checker |
|
LKC |
Lung Kwu Chau |
|
MTCC |
Marine Traffic Control Centre |
|
MMHK |
Mott MacDonald Hong Kong Limited |
|
MMWP |
Marine Mammal Watching Plan |
|
MSS |
Maritime Surveillance System |
|
MTRMP-CAV |
Marine Travel Routes and Management Plan for Construction and Associated Vessel |
|
NEL |
Northeast Lantau |
|
NWL |
Northwest Lantau |
|
PAM |
Passive Acoustic Monitoring |
|
PM |
Partial Mortality |
|
PVD |
Prefabricated Vertical Drain |
|
RBRGs |
Risk Based Remediation Goals |
|
SC |
Sha Chau |
|
SCLKCMP |
Sha Chau and Lung Kwu Chau Marine Park |
|
SPSE |
Number of On-effort Sightings per 100 Units of Survey Effort |
|
SS |
Suspended Solids |
|
STG |
Encounter Rate of Number of Dolphin Sightings |
|
SWL |
Southwest Lantau |
|
The Project |
The Expansion of Hong Kong International Airport into a Three-Runway System |
|
The SkyPier Plan |
Marine Travel Routes and Management Plan for High Speed Ferries of SkyPier |
|
T2 |
Terminal 2 |
|
T2C |
Terminal 2 Concourse |
|
TCLP |
Toxicity Characteristics Leaching Procedure |
|
TCSPS |
Tung Chung Sewage Pumping Station |
|
TSP |
Total Suspended Particulates |
|
UCS |
Unconfined Compressive Strength |
|
WL |
West Lantau |
|
WMP |
Waste Management Plan |
Executive summary
The “Expansion of Hong Kong International Airport into a Three-Runway System” (the Project) serves to meet the future air traffic demands at Hong Kong International Airport (HKIA). On 7 November 2014, the Environmental Impact Assessment (EIA) Report (Register No.: AEIAR-185/2014) for the Project was approved and an Environmental Permit (EP) (Permit No.: EP-489/2014) was issued for the construction and operation of the Project.
Airport Authority Hong Kong (AAHK) commissioned Mott MacDonald Hong Kong Limited (MMHK) to undertake the role of Environmental Team (ET) for carrying out the Environmental Monitoring & Audit (EM&A) works during the construction phase of the Project in accordance with the Updated EM&A Manual (the Manual).
This is the 6th Construction Phase Annual EM&A Report for the Project which summarizes the monitoring results and audit findings of the EM&A programme during the reporting period from 1 January 2021 to 31 December 2021.
Key Activities in the Reporting Period
Key activities of the Project carried out in the reporting period were related to the following contracts:
Reclamation Works:
Contract 3206 Main Reclamation Works
● Land-based ground improvement works;
● Marine and land filling;
● Deep Cement Mixing (DCM) works;
● Seawall construction; and
● Backfilling works.
Airfield Works:
Contract 3301 North Runway Crossover Taxiway
● Subgrade compaction works;
● Cable ducting works; and
● Paving works.
Contract 3302 Eastern Vehicular Tunnel Advance Works
● Trench excavation works;
● Piling and structure works;
● Cable laying and ducting works; and
● Backfilling and reinstatement works.
Contract 3303 Third Runway and Associated Works
● Land-based ground improvement works;
● Piling work;
● Box culvert construction;
● Cable laying and ducting works;
● Construction of runway and associated facilities;
● Construction of approach light; and
● Construction and operation of asphalt plant.
Contract 3305 Airfield Ground Lighting System
● Delivery and installation of lighting system;
● Network and Genset installation;
● Cabling works; and
● Site office establishment.
Contract 3306 Observation Facility Control System Supporting Interim 2RS and 3RS
● Consoles, system and network installation; and
● Cabling works.
Contract 3307 Fire Training Facility
● Excavation works;
● Building construction;
● Architectural, builder’s and finishing works; and
● Drainage and utilities works.
Contract 3308 Foreign Object Debris Detection System
● Site formation;
● Footing works; and
● Foreign Object Debris Tower installation.
Contract 3310 North Runway Modification Works
● Ground improvement works;
● Piling work; and
● Steel deck erection.
Third Runway Concourse:
Contract 3403 New Integrated Airport Centres Building and Civil Works
● Excavation and foundation works;
● Pre-boring and sheetpiling works;
● Cable and lightning pit installation;
● Completion of video wall supporting frame and roof cladding system;
● Architectural, Builder’s Work and Finishing works; and
● Drainage and ducting works.
Contract 3404 Integrated Airport Control System
● Equipment installation; and
● Cable laying.
Contract 3405 Three Runway Concourse Foundation and Substructure Works
● Foundation works;
● Sheet piling and pile cap construction;
● Excavation and backfilling; and
● Road formation.
Contract 3408 Third Runway Concourse and Apron Works
● Site setup works; and
● Excavation and lateral support works.
Terminal 2 (T2) Expansion:
Contract 3503 Terminal 2 Foundation and Substructure Works
● T2 re-configuration;
● Excavation works;
● Utilities road work; and
● Piling and structure works.
Contract 3508 Terminal 2 Expansion Works
● Site formation;
● Piling and builders’ works;
● Excavation and footing construction;
● Temporary road construction and bridge demolition; and
● Drainage works.
Automated People Mover (APM) and Baggage Handling System (BHS):
Contract 3601 New Automated People Mover System (TRC Line)
● Concreting work and rebar fixing;
● Formwork erection and removal; and
● Guidebeam installation.
Contract 3602 Existing APM System Modification Works
● Modification works at APM depot;
● Concreting work;
● Formwork erection; and
● Car modification.
Baggage Handling System (BHS) Works:
Contract 3603 3RS Baggage Handling System
● BHS modification work; and
● Dismantling works.
Construction Support (Facilities):
Contract 3721 Construction Support Infrastructure Works
● Excavation and backfilling;
● Paving works; and
● Laying of drainage pipes and ducts.
Contract 3722 Construction Support Facilities
● Foundation works;
● Erection of formwork and superstructure;
● Electrical and mechanical installation; and
● Site establishment.
Contract 3723 Construction Support Facilities
● Foundation works;
● Erection of superstructure;
● Electrical and mechanical installation;
● Sewage pump and treatment system installation; and
● Site establishment.
Airport Support Infrastructure:
Contract 3801 APM and BHS Tunnels on Existing Airport Island
● Construction of slab, box culvert, working platform, ventilation ducts and ventilation building;
● Cofferdam installation for shaft;
● Hanger support and soil nail installation;
● Formwork, rebar fixing and casting;
● Demolition and drainage works; and
● Excavation works and backfilling.
Contract 3802 APM and BHS Tunnels and Related Works
● Foundation works;
● Pipe pile and sheet pile works;
● Construction of Airside Fire Station and marine sediment treatment plant;
● Construction of Wall and slab;
● Installation of sheet pipes, storm drain pipes and dewatering well;
● Site establishment; and
● Excavation and ducting works.
Construction Support (Services / Licences):
Contract 3901A Concrete Batching Facility
● Installation of plant equipment;
● Construction of plant and material conveyor belt;
● Construction of drainage, pavement and fencing;
● Erection of superstructure; and
● Operation of concrete batching plant.
Contract 3901B Concrete Batching Facility
● Installation of plant equipment;
● Construction of drainage, pavement and fencing;
● Concreting work;
● Erection of superstructure;
● Operation of concrete batching plant; and
● Testing and commissioning for conveyor belt.
EM&A Activities Conducted in the Reporting Period
The EM&A programme was undertaken in accordance with the Manual. Summary of monitoring activities during this reporting period is presented as below:
|
Monitoring/ Audit Activities |
Number of Sessions |
|
Air Quality Monitoring |
378 |
|
Noise Monitoring |
208 |
|
Water Quality Monitoring |
153 |
|
Vessel line-transect surveys for Chinese White Dolphin (CWD) monitoring |
24 |
|
Land-based theodolite tracking survey effort for CWD monitoring |
24 |
Environmental auditing works, including weekly site inspections of construction works conducted by the ET and bi-weekly site inspections conducted by the Independent Environmental Checker (IEC), audit of SkyPier High Speed Ferries (HSF), audit of construction and associated vessels, and audit of implementation of Marine Mammal Watching Plan (MMWP) and Dolphin Exclusion Zone (DEZ) Plan, were conducted in the reporting period. Based on the information including ET’s observations, records of Maritime Surveillance System (MSS), and contractors’ site records, it is noted that the environmental pollution control and mitigation measures were properly implemented and the construction activities of the Project in the reporting period did not introduce adverse impact to the environment.
In accordance with Section 6.2.1.1 of the Manual, the methodology of annual sewage flow monitoring for the existing gravity sewer from the airport discharge manhole to Tung Chung Sewage Pumping Station (TCSPS) should be prepared and submitted to EPD one year before the scheduled commencement of operation of the proposed third runway. As such, the sewage flow monitoring methodology paper was prepared, submitted and subsequently approved by EPD on 21 June 2021. The annual sewage flow monitoring has also been started since June 2021. According to the daily flow monitoring record of Sewage Pumping Station 1 (SPS-1) located at the Airport from June to December 2021 (see Appendix D), the daily average flow ranged from 13,448 (m3/day) to 16,319 (m3/day), which were well below 80% of pipe full flow capacity of 53,395.2 m3/day as defined in Section 2.6.3 of the approved sewage flow monitoring methodology paper. For the subsequent sets of sewage flow monitoring data for SPS-1, it will be presented in upcoming Quarterly and Annual EM&A Reports.
Summary Findings of the EM&A Programme
The monitoring works for construction dust, construction noise, water quality, construction waste, landscape & visual, and CWD were conducted during the reporting period in accordance with the Manual.
Monitoring results of construction dust, construction waste, and CWD did not trigger the corresponding Action and Limit Levels in the reporting period.
One monitoring result of construction noise triggered the relevant Limit Level, and the corresponding investigation was conducted as stipulated in the EM&A programme. The investigation findings concluded that the exceedance was not due to the Project.
The water quality monitoring results for turbidity, total alkalinity and nickel obtained during the reporting period were within the corresponding Action and Limit Levels stipulated in the EM&A programme. Relevant investigation and follow-up actions will be conducted according to the EM&A programme if the corresponding Action and Limit Levels are triggered. For dissolved oxygen (DO), suspended solids (SS) and chromium, some of the monitoring results triggered the relevant Action or Limit Levels, and the corresponding investigations were conducted accordingly. The investigation findings concluded that all cases were not related to the Project. To conclude, the construction activities in the monitoring period did not introduce adverse impact to all water quality sensitive receivers.
Summary Table
The Key findings of the EM&A programme during the reporting period are summarised as below:
|
|
Yes |
No |
Details |
Analysis / Recommendation / Remedial Actions |
|
Breach of Limit Level^ |
|
√ |
No exceedance of project-related Limit Level was recorded. |
Nil |
|
Breach of Action Level^ |
|
√ |
No exceedance of project-related Action Level was recorded. |
Nil |
|
Complaints Received |
√ |
|
Twenty complaints were received in 2021: 25 Jan (3 complaints received), 1 Feb, 2 Feb, 3 Feb, 9 Feb, 20 Apr, 14 May, 21 Jun (2 complaints received), 28 Jun, 13 Jul, 6 Oct, 29 Oct, 7 Nov, 15 Nov, 24 Nov, 1 Dec and 13 Dec 2021. |
The complaint investigations were carried out in accordance with the Complaint Management Plan. Details are presented in S3.2.1. |
|
Notification of any summons and status of prosecutions |
√ |
|
A contractor reported in October 2021 that they had pleaded guilty in court regarding a dust control emission incident for reclamation works in April 2021. |
Nil |
|
Changes that affect the EM&A |
|
√ |
There was no change to the construction works that may affect the EM&A. |
Nil |
Remarks: ^ Only triggering of Action or Limit Level found related to Project works is counted as Breach of Action or Limit Level.
1
Introduction
1.1
Background
On 7 November 2014, the Environmental Impact Assessment (EIA) Report (Register No.: AEIAR-185/2014) for the “Expansion of Hong Kong International Airport into a Three-Runway System” (the Project) was approved and an Environmental Permit (EP) (Permit No.: EP-489/2014) was issued for the construction and operation of the Project.
Airport Authority Hong Kong (AAHK) commissioned Mott MacDonald Hong Kong Limited (MMHK) to undertake the role of Environmental Team (ET) for carrying out the Environmental Monitoring & Audit (EM&A) works during the construction phase of the Project in accordance with the Manual[1] submitted under EP Condition 3.1. AECOM Asia Company Limited (AECOM) was employed by AAHK as the Independent Environmental Checker (IEC) for the Project.
The Project covers the expansion of the existing airport into a three-runway system (3RS) with key project components comprising land formation of about 650 hectares and all associated facilities and infrastructure including taxiways, aprons, aircraft stands, a passenger concourse, an expanded Terminal 2, all related airside and landside works and associated ancillary and supporting facilities. The existing submarine aviation fuel pipelines and submarine power cables also require diversion as part of the works.
Construction of the Project is to proceed in the general order of diversion of the submarine aviation fuel pipelines, diversion of the submarine power cables, land formation, and construction of infrastructure, followed by construction of superstructures.
The summary of construction works programme can be referred to the corresponding Monthly EM&A Reports. Description of relevant contracts in the reporting period is presented in Appendix A.
1.2
Scope of this Report
This is the 6th Construction Phase Annual EM&A Report for the Project which summarizes the key findings of the EM&A programme during the reporting period from 1 January 2021 to 31 December 2021.
1.3
Project Organization
The Project’s organization structure and the contact details of the key personnel are provided in Appendix B and Table 1.1 respectively.
Table 1.1: Contact Information of Key Personnel
|
Party |
Position |
Name |
Telephone |
|
Project Manager’s Representative (Airport Authority Hong Kong) |
Principal Manager, Environmental Compliance, Sustainability |
Lawrence Tsui |
2183 2734 |
|
Environmental Team (ET) (Mott MacDonald Hong Kong Limited) |
Environmental Team Leader |
Terence Kong |
2828 5919 |
|
Deputy Environmental Team Leader |
Heidi Yu |
2828 5704 |
|
|
Ken Wong |
2828 5817 |
||
|
Independent Environmental Checker (IEC) (AECOM Asia Company Limited) |
Independent Environmental Checker |
Jackel Law |
3922 9376
|
|
Deputy Independent Environmental Checker |
Roy Man |
3922 9141 |
Reclamation Works:
|
Party |
Position |
Name |
Telephone |
|
Contract 3206 Main Reclamation Works (ZHEC-CCCC-CDC Joint Venture) |
Project Manager |
Alan Mong |
3763 1352 |
|
Environmental Officer |
Zhang Bin Wang |
3763 1451 |
Airfield Works:
|
Party |
Position |
Name |
Telephone |
|
Contract 3301 North Runway Crossover Taxiway (FJT-CHEC-ZHEC Joint Venture) |
Deputy Project Director |
Kin Hang Chung |
9800 0048 |
|
Environmental Officer |
Joe Wong |
6182 0351 |
|
|
Contract 3302 Eastern Vehicular Tunnel Advance Works (China Road and Bridge Corporation) |
Project Manager
|
Dickey Yau |
5699 4503 |
|
Environmental Officer |
Dennis Ho |
5645 0563 |
|
|
Contract 3303 Third Runway and Associated Works (SAPR Joint Venture) |
Project Manager
|
Andrew Keung |
6277 6628 |
|
Environmental Officer
|
Gabriel Wong |
6114 9590 |
|
|
Contract 3305 Airfield Ground Lighting System (ADB Safegate Hong Kong Limited) |
Project Manager
|
Allam Al-Turk |
2944 9725 |
|
Environmental Officer
|
Calvin Sze |
9205 9277 |
|
|
Contract 3306 Observation Facility Control System Supporting Interim 2RS and 3RS (Chinney Alliance Engineering Limited) |
Project Director |
Dennis Yam |
9551 9920
|
|
Environmental Officer |
Richard Liu |
9216 8990
|
|
|
Contract 3307 Fire Training Facility (Paul Y. Construction Company Limited) |
Project Manager
|
Chris Wong |
6110 1157 |
|
Environmental Officer |
Albert Chan |
9700 1083 |
|
|
Contract 3308 Foreign Object Debris Detection System (DAS Aviation Services Group) |
Project Manager
|
Jeffrey Yau |
9873 7422 |
|
Contract 3310 North Runway Modification Works (China State Construction Engineering (Hong Kong) Ltd.) |
Project Manager
|
Kingsley Chiang |
9424 8437 |
|
Environmental Officer |
Federick Wong |
9842 2703 |
Third Runway Concourse:
|
Party |
Position |
Name |
Telephone |
|
Contract 3402 New Integrated Airport Centres Enabling Works (Wing Hing Construction Co., Ltd.) |
Contract Manager |
Michael Kan |
9206 0550 |
|
Environmental Officer |
Lisa He |
5374 3418 |
|
|
Contract 3403 New Integrated Airport Centres Building and Civil Works (Sun Fook Kong Construction Limited) |
Project Manager |
Alice Leung |
9220 3162 |
|
Environmental Officer |
Ray Cheung |
9785 1566 |
|
|
Contract 3404 Integrated Airport Control System (Shun Hing Systems Integration Co., Ltd.) |
Project Manager |
Andy Ng
|
9102 2739 |
|
Environmental Officer |
Richard Ng
|
9802 9577
|
|
|
Contract 3405 Third Runway Concourse Foundation and Substructure Works (China Road and Bridge Corporation – Bachy Soletanche Group Limited – LT Sambo Co., Ltd. Joint Venture) |
Project Manager
|
Francis Choi |
9423 3469 |
|
Environmental Officer |
Jacky Lai
|
9028 8975 |
|
|
Contract 3408 Third Runway Concourse and Apron Works (Beijing Urban Construction Group Company Limited and Chevalier (Construction) Company Limited Joint Venture) |
Assistant Project Manager |
Qian Zhang
|
5377 7976 |
|
Environmental Officer |
Malcolm Leung |
7073 7559 |
Terminal 2 (T2) Expansion Works:
|
Party |
Position |
Name |
Telephone |
|
Contract 3503 Terminal 2 Foundation and Substructure Works (Leighton – Chun Wo Joint Venture) |
Project Manager |
Eric Wu |
3973 1718 |
|
Environmental Officer |
Rex Yiu |
6465 6861 |
|
|
Contract 3508 Terminal 2 Expansion Works (Gammon Engineering & Construction Company Limited) |
Project Manager |
Richard Ellis |
6201 5637 |
|
Environmental Officer |
Fanny Law |
6184 4650 |
Automated People Mover (APM) and Baggage Handling System (BHS):
|
Party |
Position |
Name |
Telephone |
|
Contract 3601 New Automated People Mover System (TRC Line) (CRRC Puzhen Bombardier Transportation Systems Limited and CRRC Nanjing Puzhen Co., Ltd. Joint Venture) |
Project Manager |
Hongdan Wei |
158 6180 9450 |
|
Environmental Officer |
P L Wong |
9143 2185 |
|
|
Contract 3602 Existing APM System Modification Works (Niigata Transys Co., Ltd.) |
Project Manager |
Kunihiro Tatecho |
9755 0351 |
|
Environmental Officer |
Jack Chow |
9880 6338 |
|
|
Contract 3603 3RS Baggage Handling System (VISH Consortium) |
Project Manager
|
K C Ho |
9272 9626 |
|
Environmental Officer
|
Eric Ha |
9215 3432 |
Construction Support (Facilities):
|
Party |
Position |
Name |
Telephone |
|
Contract 3721 Construction Support Infrastructure Works (China State Construction Engineering (Hong Kong) Ltd.) |
Site Agent |
Thomas Lui |
9011 5340 |
|
Environmental Officer |
Gary Yeung |
9042 1720 |
|
|
Contract 3722 Western Support Area – Construction Support Facilities (Tapbo Construction Company Limited and Konwo Modular House Limited Joint Venture) |
Deputy Project Director |
Philip Kong |
9049 3161 |
|
Environmental Officer |
Eddie Suen |
6338 8862 |
|
|
Contract 3723 Eastern Support Area – Construction Support Facilities (Tapbo Construction Company Limited and Konwo Modular House Ltd. Joint Venture.) |
Deputy Project Director |
Philip Kong
|
9337 8700 |
|
Environmental Officer |
Eddie Suen |
6338 8862 |
|
|
Contract 3728 Minor Site Works (Shun Yuen Construction Company Limited) |
Contract Manager |
C K Liu |
9194 8739 |
|
Environmental Officer |
Dan Leung |
6856 5899 |
|
|
Contract 3733 Emergency Repair Service (Wing Hing Construction Co., Ltd.)
|
Project Manager |
Michael Kan
|
9206 0550 |
|
SHE Manager |
Mike Leung |
6625 2550 |
Airport Support Infrastructure:
|
Party |
Position |
Name |
Telephone |
|
Contract 3801 APM and BHS Tunnels on Existing Airport Island (China State Construction Engineering (Hong Kong) Ltd.) |
Project Manager
|
Kingsley Chiang |
9424 8437 |
|
Environmental Officer
|
Eunice Kwok |
9243 1331 |
|
|
Contract 3802 APM and BHS Tunnels and Related Works (Gammon Engineering & Construction Company Limited) |
Project Manager |
John Adams |
6111 6989 |
|
Environmental Officer |
Phoebe Ng |
9869 1105 |
Construction Support (Services / Licences):
|
Party |
Position |
Name |
Telephone |
|
Contract 3901A Concrete Batching Facility (K. Wah Concrete Company Limited) |
Project Manager
|
Benedict Wong |
9553 2806 |
|
Environmental Officer
|
C P Fung |
9874 2872 |
|
|
Contract 3901B Concrete Batching Facility (Gammon Construction Limited) |
Project Manager
|
Gabriel Chan |
2435 3260 |
|
Environmental Officer
|
Rex Wong |
2695 6319 |
1.4
Contact Information for the Project
The contact information for the Project is provided in Table 1.2. The public can contact us through the following channels if they have any queries and comments on the environmental monitoring data and project related information.
Table 1.2: Contact Information of the Project
|
Channels |
Contact Information |
|
Hotline |
3908 0354 |
|
|
|
|
Fax |
3747 6050 |
|
Postal Address |
Airport Authority Hong Kong HKIA Tower 1 Sky Plaza Road Hong Kong International Airport Lantau Hong Kong Attn: Environmental Team Leader Mr Terence Kong c/o Mr Lawrence Tsui (TRD) |
1.5
Summary of Construction Works
The key activities of the Project carried out in the reporting period are located in reclamation areas and existing airport island respectively. Works in the reclamation areas included excavation and foundation works for Terminal 2 Concourse (T2C), ground improvement works, DCM works, marine and land filling, seawall, site office and facilities construction, together with runway and associated works such as bored piling for approach lights, box culvert and asphalt plant construction, console network, genset, lighting system and foreign object debris tower installation. Land-based works on existing airport island involved mainly airfield works, excavation and foundation works for Terminal 2 expansion, modification and tunnel works for Automated People Mover (APM) and Baggage Handling System (BHS), and preparation work for utilities, with activities include site establishment, site office construction, electrical and mechanical installation, road and drainage works, cable ducting, demolition, piling, and excavation works.
Overall, the construction progress of the Project was generally maintained in spite of the impact of Coronavirus Disease 2019 (COVID-19). Pavement of the Third Runway was completed and a ceremony for capturing this milestone was held in September 2021. AAHK has also implemented various effective measures (i.e. handover of or early access to works areas among different contractors, deployment of extra resources in extended working hours and re-sequencing of works to prioritize the completion of all critical works etc.) to ensure that the overall progress of the Project was anticipatedly proceeded according to the planned schedule, and aimed to support the entire project programme to commission the Third Runway in 2022 and the completion of 3RS in 20241.
The locations of the works areas are
presented in Figure 1.1.
__________________________
1Details of the construction progress of the Project refer to the “Update on the Development of the Three-Runway System at Hong Kong International Airport (LC Paper No. CB(4)1696/20-21(01))” available on related website (https://www.thb.gov.hk/eng/legislative/transport/panel/air/20211027.pdf)
1.6
Summary of EM&A Programme Requirements
The status for all environmental aspects is presented in Table 1.3.
Table 1.3: Summary of Status for All Environmental Aspects under the Manual
|
Parameters |
EM&A Requirements |
Status |
|
Air Quality |
||
|
Baseline Monitoring |
At least 14 consecutive days before commencement of construction work |
The baseline air quality monitoring results were reported in Baseline Monitoring Report and submitted to EPD under EP Condition 3.4. |
|
Impact Monitoring |
At least 3 times every 6 days |
On-going |
|
Noise |
||
|
Baseline Monitoring |
Daily for a period of at least two weeks prior to the commencement of construction works |
The baseline noise monitoring results were reported in Baseline Monitoring Report and submitted to EPD under EP Condition 3.4. |
|
Impact Monitoring |
Weekly |
On-going |
|
Water Quality |
||
|
General Baseline Water Quality Monitoring for reclamation, water jetting and field joint works |
Three days per week, at mid-flood and mid-ebb tides, for at least four weeks prior to the commencement of marine works. |
The baseline water quality monitoring results were reported in Baseline Water Quality Monitoring Report and submitted to EPD under EP Condition 3.4. |
|
General Impact Water Quality Monitoring for reclamation, water jetting and field joint works |
Three days per week, at mid-flood and mid-ebb tides. |
On-going for reclamation works. General impact water quality monitoring for water jetting works was completed on 23 May 2017. |
|
Initial Intensive Deep Cement Mixing (DCM) Water Quality Monitoring |
At least four weeks |
The Initial Intensive DCM Monitoring Report was submitted and approved by EPD in accordance with the Detailed Plan on DCM. |
|
Regular DCM Water Quality Monitoring |
Three times per week until completion of DCM works. |
In view of the completion of marine-based DCM, regular DCM monitoring was ceased since 14 January 2021. However, due to a resumption of marine-based DCM works for Contract 3206 in February 2021, the regular DCM monitoring was resumed at all monitoring stations starting from 2 February 2021. As of May 2021, the aforementioned marine-based DCM works were completed, hence the regular DCM monitoring was ceased again at all monitoring stations starting from 24 June 2021 and would be resumed if there are marine-based DCM works in the coming future. |
|
Sewerage and Sewage Treatment |
||
|
Methodology for carrying out annual sewage flow monitoring for concerned gravity sewer |
Methodology to be prepared and submitted to EPD at least one year before commencement of the operation of 3RS |
The proposed methodology of the annual sewage flow monitoring was approved by EPD. The annual flow monitoring has been started since June 2021. |
|
Details of the routine H2S monitoring system for the sewerage system of 3RS |
Details to be prepared and submitted to EPD at least one year before commencement of the operation of 3RS |
The details of the routine H2S monitoring system will be prepared and submitted to EPD at least one year before commencement of operation of 3RS. |
|
Waste Management |
||
|
Waste Monitoring |
At least weekly |
On-going |
|
Land Contamination |
||
|
Supplementary Contamination Assessment Plan (CAP) |
At least 3 months before commencement of any soil remediation works. |
The Supplementary CAP was submitted and approved by EPD pursuant to EP condition 2.20. |
|
Contamination Assessment Report (CAR) |
CAR to be submitted for golf course |
The CAR for Golf Course was submitted and accepted by EPD. |
|
CAR to be submitted for Terminal 2 Emergency Power Supply Systems |
The CARs for Terminal 2 Emergency Power Supply Systems were submitted and accepted by EPD.
|
|
|
Terrestrial Ecology |
||
|
Pre-construction Egretry Survey Plan |
Once per month in the breeding season between April and July, prior to the commencement of HDD drilling works. |
The revised Egretry Survey Plan was submitted and approved by EPD under EP Condition 2.14. |
|
Ecological Monitoring |
Monthly monitoring during the HDD construction works period from August to March. |
The terrestrial ecological monitoring at Sheung Sha Chau was completed in January 2019. |
|
Marine Ecology |
||
|
Pre-Construction Phase Coral Dive Survey |
Prior to marine construction works |
The Coral Translocation Plan was submitted and approved by EPD under EP Condition 2.12. |
|
Coral Translocation |
- |
The coral translocation was completed on 5 January 2017. |
|
Coral Post-translocation Monitoring |
As per an enhanced monitoring programme based on the Coral Translocation Plan |
The post-translocation monitoring programme according to the Coral Translocation Plan was completed in April 2018. |
|
Chinese White Dolphins (CWD) |
||
|
Baseline Monitoring |
6 months of baseline surveys before the commencement of land formation related construction works. Vessel line transect surveys: Two full surveys per month; Land-based theodolite tracking surveys: Two days per month at the Sha Chau station and two days per month at the Lung Kwu Chau station; and Passive Acoustic Monitoring (PAM): For the whole duration of baseline period. |
Baseline CWD results were reported in the CWD Baseline Monitoring Report and submitted to EPD in accordance with EP Condition 3.4. |
|
Impact Monitoring |
Vessel line transect surveys: Two full surveys per month; Land-based theodolite tracking surveys: One day per month at the Sha Chau station and one day per month at the Lung Kwu Chau station; and PAM: For the whole duration for land formation related construction works. |
On-going |
|
Landscape and Visual |
||
|
Landscape and Visual Plan |
At least 3 months before the commencement of construction works on the formed land of the Project. |
The Landscape & Visual Plan was submitted to EPD under EP Condition 2.18. |
|
Baseline Monitoring |
One-off survey within the Project site boundary prior to commencement of any construction works |
The baseline landscape & visual monitoring result has been reported in Baseline Monitoring Report and submitted to EPD under EP Condition 3.4. |
|
Impact Monitoring |
Weekly |
On-going |
|
Environmental Auditing |
||
|
Regular site inspection |
Weekly |
On-going |
|
Marine Mammal Watching Plan (MMWP) implementation measures |
Monitor and check |
On-going |
|
Dolphin Exclusion Zone (DEZ) Plan implementation measures |
Monitor and check |
On-going |
|
SkyPier High Speed Ferries (HSF) implementation measures |
Monitor and check |
On-going |
|
Construction and Associated Vessels implementation measures |
Monitor and check |
On-going |
|
Complaint Hotline and Email channel |
Construction phase |
On-going |
|
Environmental Log-book |
Construction phase |
On-going |
|
Silt Curtain Deployment Plan implementation measures |
Monitor and check |
On-going |
|
Spill Response Plan implementation measures |
Monitor and check |
On-going |
Taking into account the construction works in the reporting period, impact monitoring of air quality, noise, water quality, waste management, landscape and visual, and CWD were carried out in the reporting period.
The EM&A programme also involved weekly site inspections and related auditing conducted by the ET for checking the implementation of the required environmental mitigation measures as recommended in the approved EIA Report. To promote the environmental awareness and enhance the environmental performance of the contractors, environmental briefings, environmental trainings, and regular environmental management meetings were conducted during the reporting period which are summarized as below:
§ 21 skipper trainings provided by ET;
§ 3 environmental briefings on EP and EM&A requirements of the 3RS provided by ET; and
§ 206 environmental management meetings for EM&A review with works contracts.
The EM&A programme has been undertaken in accordance with the recommendations presented in the approved EIA Report and the Manual. Despite that, the implementation of the EM&A programme was slightly affected by various events in the reporting period. In view of the local COVID-19 pandemic situation, special work arrangement, such as working from home, was implemented among government departments in several periods to reduce the flow of people and social contacts in the community. There were confirmed case of COVID-19 among some of the contractors and sub-contractors under the Project in 20211. Besides, inclement weather events including tropical cyclones, rainstorms, and thunderstorms have also affected the regular schedules for water quality monitoring and site inspections. A summary of implementation status of the environmental mitigation measures for the construction phase of the Project during the reporting period is provided in Appendix C.
___________________________
1Details of the construction progress
of the Project refer to the “Update on the Development of the Three-Runway
System at Hong Kong International Airport (LC Paper No. CB(4)1696/20-21(01))”
available on related website (https://www.thb.gov.hk/eng/legislative/transport/panel/air/20211027.pdf)
2
Environmental Monitoring and Auditing
2.1
Air
Quality Monitoring
Impact 1-hour Total Suspended Particulates (TSP) monitoring was conducted three times every six days at two representative monitoring stations during the reporting period. The locations of monitoring stations are described in Table 2.1 and presented in Figure 2.1.
2.1.1
Action and Limit Levels
The Action and Limit Levels of the air quality monitoring stipulated in the EM&A programme for triggering the relevant investigation and follow-up procedures under the programme are provided in Table 2.1.
Table 2.1: Impact Air Quality Monitoring Stations
|
Monitoring Station |
Location |
Action Level (mg/m3) |
Limit Level (mg/m3) |
|
AR1A |
Man Tung Road Park |
306 |
500 |
|
AR2 |
Village House at Tin Sum |
298 |
2.1.2
Monitoring Results
The graphical plots of impact air quality monitoring results during the reporting period are presented in Appendix D. Percentage of monitoring results within their corresponding Action and Limit Levels in the reporting period are presented in Table 2.2.
Table 2.2: Percentage of Air Quality Monitoring Results within Action and Limit Levels
|
AR1A |
AR2 |
|
|
Jan 2021 |
100% |
100% |
|
Feb 2021 |
100% |
100% |
|
Mar 2021 |
100% |
100% |
|
Apr 2021 |
100% |
100% |
|
May 2021 |
100% |
100% |
|
Jun 2021 |
100% |
100% |
|
Jul 2021 |
100% |
100% |
|
Aug 2021 |
100% |
100% |
|
Sep 2021 |
100% |
100% |
|
Oct 2021 |
100% |
100% |
|
Nov 2021 |
100% |
100% |
|
Dec 2021 |
100% |
100% |
|
Overall |
100% |
100% |
|
Note: The percentages are calculated by dividing the number of monitoring results within their corresponding Action and Limit Level by the total number of monitoring results. |
||
All monitoring results at AR1A and AR2 were within their corresponding Action and Limit Levels.
General meteorological conditions throughout the impact monitoring period were recorded and summarized in Table 2.3.
Table 2.3: General Meteorological Condition during Impact Air Quality Monitoring
|
Weather |
Wind Direction |
|
|
Jan – Mar 2021 |
Sunny to Cloudy |
Northwest or Southwest |
|
Apr – Jun 2021 |
Sunny to Cloudy |
Southwest |
|
Jul – Sep 2021 |
Sunny to Cloudy |
Southwest |
|
Oct – Dec 2021 |
Sunny to Overcast |
Southwest or Northwest |
2.1.3
Conclusion
No dust emission source was observed at the monitoring stations during the monitoring sessions. As the sensitive receivers were far away from the construction activities, with the implementation of dust control measures, there was no adverse impact at the sensitive receivers attributable to the works of the Project.
2.2
Noise Monitoring
Impact noise monitoring was conducted at four representative monitoring stations once per week during 0700 and 1900 in the reporting period. The locations of monitoring stations are described in Table 2.4 and presented in Figure 2.1.
2.2.1
Action and Limit Levels
The Action and Limit levels of the noise monitoring stipulated in the EM&A programme for triggering the relevant investigation and follow-up procedures under the programme are provided in Table 2.4.
Table 2.4: Impact Noise Monitoring Stations
|
Monitoring Station |
Location |
Action Level |
Limit Level |
|
NM1A |
Man Tung Road Park |
When one documented complaint is received from any one of the sensitive receivers |
75 dB(A) |
|
NM4 |
Ching Chung Hau Po Woon Primary School |
65dB(A) / 70 dB(A) (i) |
|
|
NM5 |
Village House in Tin Sum |
75 dB(A) |
|
|
NM6 |
House No. 1, Sha Lo Wan |
75 dB(A) |
|
|
Note: (i) The Limit Level for NM4 is reduced to 70dB(A) for being an educational institution. During school examination period, the Limit Level is further reduced to 65dB(A). |
|||
2.2.2
Monitoring Results
The graphical plots of impact noise quality monitoring results during the reporting period are presented in Appendix D. Percentage of monitoring results within their corresponding Action and Limit Levels in the reporting period are presented in Table 2.5.
Table 2.5: Percentage of Noise Monitoring Results within Action and Limit Levels
|
|
NM1A |
NM4 |
NM5 |
NM6 |
|
Jan 2021 |
100% |
100% |
100% |
100% |
|
Feb 2021 |
100% |
100% |
100% |
100% |
|
Mar 2021 |
100% |
100% |
100% |
100% |
|
Apr 2021 |
100% |
100% |
100% |
100% |
|
May 2021 |
75% |
100% |
100% |
100% |
|
Jun 2021 |
100% |
100% |
100% |
100% |
|
Jul 2021 |
100% |
100% |
100% |
100% |
|
Aug 2021 |
100% |
100% |
100% |
100% |
|
Sep 2021 |
100% |
100% |
100% |
100% |
|
Oct 2021 |
100% |
100% |
100% |
100% |
|
Nov 2021 |
100% |
100% |
100% |
100% |
|
Dec 2021 |
100% |
100% |
100% |
100% |
|
Overall |
98.1% |
100% |
100% |
100% |
|
Note: The percentages are calculated by dividing the number of monitoring results within their corresponding Action and Limit Level by the total number of monitoring results. |
||||
No complaints were received from any sensitive receiver that triggered the Action Level.
One of the monitoring results triggered the corresponding Limit Level at NM1A on 28 May 2021. Actions were taken accordingly based on the established Event and Action Plan as presented in the Manual. Details of the investigation findings are presented in Construction Phase Monthly EM&A Report No. 65, which concluded that the case was not related to the Project.
General weather conditions throughout the impact monitoring period were recorded and summarized in Table 2.6.
Table 2.6: General Weather Condition during Impact Noise Monitoring
|
Weather |
|
|
Jan – Mar 2021 |
Sunny to Cloudy |
|
Apr – Jun 2021 |
Sunny to Cloudy |
|
Jul – Sep 2021 |
Sunny to Cloudy |
|
Oct – Dec 2021 |
Sunny to Drizzle |
2.2.3
Conclusion
Major sources of noise dominating the monitoring stations observed during the construction noise impact monitoring were road traffic noise near NM1A, school activities at NM4, and aircraft noise near NM5 and NM6 during the reporting period. As the sensitive receivers were far away from the construction activities, with the implementation of noise control measures, there was no adverse impact at the sensitive receivers attributable to the works of the Project.
2.3
Water Quality Monitoring
Impact water quality monitoring of the Project commenced on 4 Aug 2016. During the reporting period, water quality monitoring was conducted three days per week, at mid-ebb and mid-flood tides, at 23 water quality monitoring stations, comprising 12 impact (IM) stations, 8 sensitive receiver (SR) stations, and 3 control (C) stations in the vicinity of the water quality sensitive receivers around the existing airport island in accordance with the Manual. The purpose of water quality monitoring at the IM stations is to promptly capture any potential water quality impacts from the Project before the impacts could become apparent at sensitive receivers (represented by the SR stations). Table 2.7 describes the details of the monitoring stations. Figure 2.2 shows the locations of the monitoring stations.
In view of the completion of marine-based DCM works from Contracts 3201, 3202, 3203, 3204, 3205 and 3206, regular DCM monitoring was ceased since 14 January 2021. However, due to a resumption of marine-based DCM works for Contract 3206, the regular DCM monitoring was resumed at all monitoring stations starting from 2 February 2021. As of May 2021, the aforementioned marine-based DCM works were completed, hence the regular DCM monitoring was ceased again at all monitoring stations starting from 24 June 2021 and would be resumed if there are marine-based DCM works in the coming future.
Table 2.7: Monitoring Locations and Parameters for Impact Water Quality Monitoring
|
Monitoring Stations |
Description |
Coordinates |
Parameters |
||
|
Easting |
Northing |
||||
|
C1 |
Control Station |
804247 |
815620 |
General Parameters: DO, pH, Temperature, Salinity, Turbidity, SS DCM Parameters Total Alkalinity, Heavy Metals (2)
|
|
|
C2 |
Control Station |
806945 |
825682 |
||
|
C3(3) |
Control Station |
817803 |
822109 |
||
|
IM1 |
Impact Station |
807132 |
817949 |
||
|
IM2 |
Impact Station |
806166 |
818163 |
||
|
IM3 |
Impact Station |
805594 |
818784 |
||
|
IM4 |
Impact Station |
804607 |
819725 |
||
|
IM5 |
Impact Station |
804867 |
820735 |
||
|
IM6 |
Impact Station |
805828 |
821060 |
||
|
IM7 |
Impact Station |
806835 |
821349 |
||
|
IM8 |
Impact Station |
808140 |
821830 |
||
|
IM9 |
Impact Station |
808811 |
822094 |
||
|
IM10 |
Impact Station |
809794 |
822385 |
||
|
IM11 |
Impact Station |
811460 |
822057 |
||
|
IM12 |
Impact Station |
812046 |
821459 |
||
|
SR1A(1) |
Hong Kong-Zhuhai-Macao Bridge Hong Kong Boundary Crossing Facilities (HKBCF) Seawater Intake for cooling |
812660 |
819977 |
General Parameters DO, pH, Temperature, Salinity, Turbidity, SS |
|
|
SR2 (3) |
Marine park / hard corals at The Brothers / Tai Mo To |
814166 |
821463 |
General Parameters DO, pH, Temperature, Salinity, Turbidity, SS DCM Parameters Total Alkalinity, Heavy Metals (2)(4) |
|
|
SR3 |
Sha Chau and Lung Kwu Chau Marine Park / fishing and spawning grounds in North Lantau |
807571 |
822147 |
General Parameters DO, pH, Temperature, Salinity, Turbidity, SS
|
|
|
SR4A |
Sha Lo Wan
|
807810 |
817189 |
||
|
SR5A |
San Tau Beach SSSI |
810696 |
816593 |
||
|
SR6A(5) |
Tai Ho Bay, Near Tai Ho Stream SSSI |
814739 |
817963 |
||
|
SR7 |
Ma Wan Fish Culture Zone (FCZ) |
823742 |
823636 |
||
|
SR8A(6) |
Seawater Intake for cooling at Hong Kong International Airport (East) |
811623 |
820390 |
||
Notes:
(1) With the operation of HKBCF, water quality monitoring at SR1A station was commenced on 25 October 2018. To better reflect the water quality in the immediate vicinity of the intake, the monitoring location of SR1A has been shifted closer to the intake starting from 5 January 2019.
(2) Details of selection criteria for the two heavy metals for early regular and regular DCM monitoring refer to the Detailed Plan on Deep Cement Mixing available on the dedicated 3RS website (http://env.threerunwaysystem.com/en/ep-submissions.html). DCM specific water quality monitoring parameters (total alkalinity and heavy metals) were only conducted at C1 to C3, SR2, and IM1 to IM12.
(3) According to the baseline water quality monitoring report, C3 station is not adequately representative as a control station of IM / SR stations during the flood tide. The control reference has been changed from C3 to SR2 from 1 September 2016 onwards.
(4) Total alkalinity and heavy metals (i.e. Nickel and Chromium) results are collected at SR2 as a control station for regular DCM monitoring.
(5) As the access to SR6 was obstructed by the construction activities and temporary structures for Tung Chung New Town Extension, the monitoring location was relocated to SR6A starting from 8 August 2019.
(6) The monitoring station for SR8 is subject to future changes due to silt curtain arrangements and the progressive relocation of this seawater intake.
2.3.1
Action and Limit Levels
The Action and Limit Levels for general water quality monitoring and regular DCM monitoring stipulated in the EM&A programme for triggering the relevant investigation and follow-up procedures under the programme are presented in Table 2.8. The control and impact stations during flood tide and ebb tide for general water quality monitoring and regular DCM monitoring are presented in Table 2.9. The weather and sea conditions during the reporting period are recorded and summarized in Table 2.10.
Table 2.8: Action and Limit Levels for General Water Quality Monitoring and Regular DCM Monitoring
Notes:
1. For DO measurement, Action or Limit Level is triggered when the monitoring result is lower than the limits.
2. For parameters other than DO, Action or Limit Level of water quality results is triggered when monitoring results is higher than the limits.
3. Depth-averaged results are used unless specified otherwise.
4. Details of selection criteria for the two heavy metals (i.e. Nickel and Chromium) for early regular and regular DCM monitoring refer to the Detailed Plan on Deep Cement Mixing available on the dedicated 3RS website http://env.threerunwaysystem.com/en/ep-submissions.html)
5. The Action and Limit Levels for the two representative heavy metals chosen will be the same as that for the intensive DCM monitoring.
6. In view of the construction programme for marine-based DCM works, regular DCM monitoring was ceased since 14 January 2021 and resumed at all monitoring stations starting from 2 February 2021. The regular DCM monitoring was ceased again at all monitoring stations starting from 24 June 2021 and would be resumed if there are marine-based DCM works in the coming future.
Table 2.9: The Control and Impact Stations during Flood Tide and Ebb Tide for General Water Quality Monitoring and Regular DCM Monitoring
|
Control Station |
Impact Stations |
|
Flood Tide |
|
|
C1 |
IM1, IM2, IM3, IM4, IM5, IM6, IM7, IM8, SR3 |
|
SR2 (1) |
IM7, IM8, IM9, IM10, IM11, IM12, SR1A, SR3, SR4A, SR5A, SR6A, SR8 |
|
Ebb Tide |
|
|
C1 |
SR4A, SR5A, SR6A |
|
C2 |
IM1, IM2, IM3, IM4, IM5, IM6, IM7, IM8, IM9, IM10, IM11, IM12, SR1A, SR2, SR3, SR7, SR8 |
Note (1): As per findings of Baseline Water Quality Report, the control reference has been changed from C3 to SR2 from 1 September 2016 onwards.
Table 2.10: General Weather Condition and Sea Condition during Impact Water Quality Monitoring
|
Weather |
Sea Condition |
|
|
Jan – Mar 2021 |
Sunny to Rainy |
Calm to Rough |
|
Apr – Jun 2021 |
Sunny to Rainy |
Calm to Rough |
|
Jul – Sep 2021 |
Sunny to Rainy |
Calm to Rough |
|
Oct – Dec 2021 |
Sunny to Cloudy |
Calm to Rough |
2.3.2
Monitoring Results
Percentage of monitoring results within their corresponding Action and Limit Levels in the reporting period are presented in Table 2.11. It should be noted that Hong Kong was under the effect of tropical cyclones from 19 to 20 July, 3 to 4 August, 8 to 10 October, and 12 to 14 October 2021 respectively, and the water quality monitoring results during the said periods might be affected by the inclement weather.
Table 2.11: Percentage of Water Quality Monitoring Results within Action and Limit Levels
|
|
General Water Quality Monitoring |
Regular DCM Monitoring |
|||||||
|
DO (Surface and Middle) |
DO (Bottom) |
SS |
Turbidity |
Alkalinity |
Chromium |
Nickel |
|
||
|
Jan 2021 |
100% |
100% |
100% |
100% |
100% |
99.2% |
100% |
|
|
|
Feb 2021 |
100% |
100% |
100% |
100% |
100% |
100% |
100% |
|
|
|
Mar 2021 |
100% |
100% |
100% |
100% |
100% |
100% |
100% |
|
|
|
Apr 2021 |
100% |
100% |
100% |
100% |
100% |
100% |
100% |
|
|
|
May 2021 |
100% |
100% |
99.8% |
100% |
100% |
100% |
100% |
|
|
|
Jun 2021 |
86.2% |
98.9% |
100% |
100% |
100% |
100% |
100% |
|
|
|
Jul 2021 |
100% |
100% |
99.4% |
100% |
- |
- |
- |
|
|
|
Aug 2021 |
95.2% |
94.5% |
100% |
100% |
- |
- |
- |
|
|
|
Sep 2021 |
97.4% |
100% |
99.6% |
100% |
- |
- |
- |
|
|
|
Oct 2021 |
100% |
100% |
98.5% |
100% |
- |
- |
- |
|
|
|
Nov 2021 |
100% |
100% |
99.8% |
100% |
- |
- |
- |
|
|
|
Dec 2021 |
100% |
100% |
99.8% |
100% |
- |
- |
- |
|
|
|
Overall |
98.2% |
99.5% |
99.8% |
100% |
100% |
99.94% |
100% |
|
|
|
Note: The percentages are calculated by dividing the number of depth-averaged results within their corresponding Action and Limit Level by the total number of depth-averaged results. |
|||||||||
The monitoring results for turbidity, total alkalinity and nickel obtained in the reporting period were within their corresponding Action and Limit Levels.
For DO, SS and chromium, some of the testing results triggered the corresponding Action or Limit Levels in the reporting period. Investigations were conducted accordingly and the details were presented in the corresponding Construction Phase Monthly EM&A Reports. The status of each water quality parameter collected in the reporting period are presented graphically in Appendix D. Some of these cases were recorded at monitoring stations located upstream of the Project based on dominant tidal flow and were considered not affected by the Project. Based on respective investigation findings, cases triggering Action or Limit Level were found not related to the Project.
2.3.3
Conclusions
During the reporting period, it was noted that the vast majority of monitoring results (from 98.2% for DO (Surface and Middle) to 100% for turbidity, total alkalinity and nickel as presented in Table 2.11) were within their corresponding Action and Limit Levels, while only a minor number of results triggered their corresponding Action or Limit Level, and investigations were conducted. Based on the findings of the investigations presented in the Construction Phase Monthly EM&A Reports for 2021, all results that triggered the corresponding Action or Limit Level were not related to the Project. Therefore, the Project did not cause adverse impact at the water quality sensitive receivers. All required actions under the Event and Action Plan were followed. These cases were considered to be due to natural fluctuation or other sources not related to the Project.
Nevertheless, the non-project related triggers have been attended to and have initiated corresponding actions and measures. As part of the EM&A programme, the construction methods and mitigation measures for water quality will continue to be monitored and opportunities for further enhancement will continue to be explored and implemented where possible, to strive for better protection of water quality and the marine environment.
In the meantime, the contractors were reminded to implement and maintain all mitigation measures during weekly site inspection and regular environmental management meetings. These include maintaining mitigation measures properly for reclamation works including DCM works, marine filling, seawall construction, and bored piling for approach lights as recommended in the Manual.
2.4
Waste Monitoring
In accordance with the Manual, the waste generated from construction activities was audited once per week to determine if waste was being managed in accordance with the Waste Management Plan (WMP) prepared for the Project, contract-specific WMP, and any statutory and contractual requirements. All aspects of waste management including waste generation, storage, transportation, and disposal were reviewed during the audits.
2.4.1
Action and Limit Levels
The Action and Limit Levels of the construction waste are provided in Table 2.12.
Table 2.12: Action and Limit Levels for Construction Waste
|
Monitoring Stations |
Action Level |
Limit Level |
|
Construction Area |
When one valid documented complaint is received |
Non-compliance of the WMP, contract-specific WMPs, any statutory and contractual requirements |
2.4.2
Summary of Monitoring Results
Weekly monitoring on all works contracts were carried out by the ET in the reporting period to check and monitor the implementation of proper waste management practices.
Recommendations made included provision and maintenance of proper chemical waste storage area, as well as proper handling, segregation, and regular disposal of general refuse. Paper, plastics, and metals were recycled in the reporting period. The contractors implemented the recommended measures to improve waste management issues. Waste management audits were carried out by ET according to the requirement of the WMP, the Manual, and the implementation schedule of the waste management mitigation measures in Appendix C.
The construction waste generated in the reporting period is summarized in Table 2.13.
Table 2.13: Statistics of Construction Waste Generated in the Reporting Period
|
|
C&D Material Stockpiled for Reuse or Recycle(1) (m3) |
C&D Material Reused in the Project (m3) |
C&D Material Reused in other Projects (m3) |
C&D Material Transferred to Public Fill (m3) |
Chemical Waste (kg) |
Chemical Waste (L)
|
General Refuse (tonne) |
|
|
Jan 2021 |
10,198 |
49,932 |
0 |
5,780 |
0 |
2,800 |
1,696 |
|
|
Feb 2021 |
17,660 |
34,759 |
0 |
3,083 |
0 |
600 |
1,209 |
|
|
Mar 2021 |
13,487 |
60,721 |
0 |
7,984 |
1,400 |
51,740 |
1,838 |
|
|
Apr 2021 |
29,633 |
57,644 |
1,766 |
4,140 |
0 |
0 |
1,194 |
|
|
May 2021 |
18,053 |
45,070 |
1,444 |
10,377 |
0 |
2,800 |
1,076 |
|
|
Jun 2021 |
17,809 |
106,196 |
0 |
5,169 |
120 |
800 |
1,235 |
|
|
Jul 2021 |
28,937 |
130,888 |
381 |
4,514 |
0 |
0 |
1,582 |
|
|
Aug 2021 |
17,930 |
94,765 |
464 |
4,059 |
0 |
1,200 |
2,064 |
|
|
Sep 2021 |
13,736 |
72,778 |
294 |
4,178 |
0 |
0 |
1,986 |
|
|
Oct 2021 |
8,018 |
20,471 |
24,211 |
3,896 |
30 |
3,400 |
1,744 |
|
|
Nov 2021 |
16,540 |
6,051 |
7,039 |
5,493 |
0 |
1,400 |
2,631 |
|
|
Dec 2021 |
4,842 |
15,538 |
1,251 |
10,204 |
600 |
2,742 |
2,764 |
|
|
Total |
196,843 |
694,813 |
36,850 |
68,877 |
2,150 |
67,482 |
21,017 |
|
|
Notes: 1. The excavated materials were temporarily stored at stockpiling area and will be reused in the Project. 2. C&D refers to Construction and Demolition. 3. Figures are rounded off to the nearest tonne. |
||||||||
There were no complaints, non-compliance of the WMP, contract-specific WMPs, statutory and contractual requirements that triggered Action and Limit Levels in the reporting period.
The Project reused numerous inert C&D materials from Government’s Public Fill Banks (i.e., Tuen Mun Area 38 and Tseung Kwan O Area 137) for land formation work and considered as a good practice for the maximisation of the intake of suitable public fill materials from Government’s Public Fill Banks for the Project. Furthermore, referring to Section 3.1.3 of the WMP, surcharge operation is no longer involved in the Project and thus no surplus surcharge materials from surcharge operation would be generated. Therefore, the total quantity of C&D materials which required off-site delivery to Government’s Public Fill Reception Facilities would be highly reduced during the construction phase of the Project.
2.4.3
Marine Sediment Management
Marine sediment was managed according to the EIA Report, Updated EM&A Manual and WMP and the proposal of Further Development on Treatment Level / Details and the Reuse Mode for Marine Sediment (hereinafter referred to as “Further Development Proposal”) of the Project. Based on EIA requirements, marine sediments would be treated using cement mixing and stabilisation/solidification method. All these treated sediments would be reused on-site as backfilling materials. The sampling process, storage conditions of the excavated marine sediment, treatment process, final backfilling location as well as associated records were inspected and checked by ET and verified by IEC to ensure they were in compliance with the requirements as stipulated in the WMP and Further Development Proposal.
2.4.3.1 Reclaimed Land Area with
Ground Improvement Works by Deep Cement Mixing
With reference to the Further Development Proposal approved on 17 January 2020, the marine sediment generated from the areas with ground improvement works of the 3RS Project was treated in-situ with cement by DCM, and the excavated materials would be reused on-site without disposal to sea, it was considered more appropriate to have the excavated materials tested against Risk Based Remediation Goals (RBRGs). Therefore, as an alternative to the testing arrangement presented in the 3RS EIA Report, the assessment approach provided in the EPD’s Practice Guide for Investigation and Remediation of Contaminated Land (hereafter referred to as “Practice Guide”) was adopted and the quality of excavated marine sediment was assessed against the most stringent RBRG limits (for Rural Residential Land Use) for eight heavy metals including Arsenic, Cadmium, Chromium, Lead, Mercury, Nickel, Zinc and Copper.
If the testing results were below the RBRGs limits, no further environmental treatment would be required for the marine sediment materials excavated from the sampling grid. However, geotechnical treatment might require for marine sediment to improve the quality as backfilling materials. If there was RBRGs exceedance in a particular heavy metal at a certain sampling depth, subsequently during work stage, excavated sediment material from such sampling depth of the concerned sampling grid which was treated with cement by DCM, depending on conditions, would be underwent further cement stabilization, before testing against the concerned heavy metal (metal parameter exceeded RBRGs) for Toxicity Characteristics Leaching Procedure (TCLP) with limits as provided in Table 2.14 (Table 4.6 of the Practice Guide) before reuse. Only excavated sediment materials from such sampling depth with exceedance of RBRGs were handled and tested against the concerned heavy metal for TCLP and Unconfined Compressive Strength (UCS) within the concerned sampling grid. The UCS was defined based on respective engineering requirements. The testing frequency for TCLP was the same as that described in Section 10.5.1.14 of the approved EIA Report, i.e. one sample per 50 m3 for the first 1,000 m3 batch of excavated sediment materials. Provided that the samples meet the TCLP limit(s), the subsequent testing frequency would be reduced to be at least two samples per 10,000 m3 batch. In the event that the required level was not achieved, the concerned whole batch should be crushed and the material would be further handled and treated as necessary. The testing frequency should be revised to one sample per 50 m3 batch (with two further samples kept for contingency) and treated samples should be taken for laboratory testing. Once the concerned heavy metal complied with the particular TCLP limit, the previous sampling frequency of at least two samples per 10,000 m3 batch should be resumed.
Table 2.14: Universal Treatment Standards for On-site Reuse of Sediment Treated by Cement Mixing and Stabilization
|
Parameters(1)(2) |
TCLP Limit (mg/L) |
|
Arsenic |
5 |
|
Cadmium |
0.11 |
|
Total Chromium |
0.6 |
|
Lead |
0.75 |
|
Mercury |
0.025 |
|
Nickel |
11 |
|
Zinc |
4.3 |
Notes:
1. Universal Treatment Standard – US 40 CFR 268.48
2. For copper, it must be reduced by at least 90% in mobility for copper through cement stabilization/solidification remedial treatment. The reduction of mobility of copper (leachable metals contaminant) should be confirmed through TCLP tests (i.e. to carry out TCLP test for the untreated sediment and for the sediment after treatment and to compare the concentrations of copper in the leachates).
A sampling grid size of 100 m x 100 m was adopted for locating sampling points for areas where marine sediment to be excavated from the newly reclaimed area. One marine sediment sample was taken if the depth of marine sediment to be excavated was less than or equalled to 3 m. If the depth of marine sediment to be excavated was less than or equalled to 6 m, a sample was taken from the depth of 0 - 3 m, and 3 - 6 m. If the marine sediment to be excavated was more than 6 m, a sample was taken from three different depths including one in the depth of 0 - 3 m, 3 - 6 m, and 6 m to the bottom of the marine sediment to be excavated. All above testing should be carried out by HOKLAS laboratory, and the results were checked by ET and IEC.
The tentative location of sampling grids where marine sediment is to be excavated from the newly reclaimed area land was presented in Appendix A of the Further Development Proposal. After the excavated details were available from the contractors, the sampling grids were further adjusted as presented in Figure 2.3. The sampling grids covered all the potential areas where marine sediment would be excavated from the newly reclaimed land. The sampling grid for each area is denoted by specific colour, the sampling grids with light green and light red shaded represent all sampling layer(s) passed RBRGs limit(s) and sampling layer(s) with parameter(s) exceeding RBRGs limit(s), respectively. Details of sampling ID and sampling depths are presented in each sampling grid. The number of grids for sampling for each area, the number of grids with pass and fail of the RBRGs results, the number of grids with marine sediment not encountered within the final excavation level and the number of grids to be sampled in future reporting period are both summarised in Table 2.15.
Table 2.15: Summary of Maine Sediment Testing Result for the Reclaimed Land Area with Ground Improvement
|
Sampling Area |
Western Vehicular Tunnel |
Eastern Vehicular Tunnel |
Airport North Fire Station(1) |
Terminal 2 Concourse(2) |
APM/BHS Tunnel and Ancillary Building with Piled Foundation |
|
|
Grid Sampling and Testing |
||||||
|
No. of Grids for Sampling |
15 |
11 |
1 |
36 |
33 |
|
|
No. of Grids with “Pass” RBRGs Results |
15 |
7 |
1 |
34 |
29 |
|
|
No. of Grids with “Fail” RBRGs Results |
0 |
1 |
0 |
2 |
3 |
|
|
No. of Grids with marine sediment not encountered within the final excavation level |
0 |
2 |
0 |
0 |
1 |
|
|
No. of Grids to be sampled in future reporting period |
0 |
1 |
0 |
14(3) |
0 |
|
|
Note: (1) Formerly known as West Fire Station. (2) Formerly known as Third Runway Concourse. (3) There are sampling requirements for the western portion of the T2C which is subject to the future development programme of this area. |
||||||
2.4.3.1.1 Western Vehicular Tunnel
and Airport North Fire Station
The Western Vehicular Tunnel (WVT) and Airport North Fire Station are covered by contract 3303. There are a total of 16 numbers of sampling grid and no exceedances of RBRGs were recorded. The zoom in figures for the presentation of grid areas of WVT and Airport North Fire Station are shown in Figure 2.3a and Figure 2.3b, respectively. The summary of sampling results is shown in Appendix E.
2.4.3.1.2 Eastern Vehicular
Tunnel and Terminal 2 Concourse
The Eastern Vehicular Tunnel (EVT) and T2C are covered by contract 3405, 3310 and 3408. There are a total of 47 numbers of sampling grid for EVT and T2C at this stage and 3 sampling grids with Arsenic exceeding RBRGs limit were recorded. No sampling works were undertaken at 2 sampling grids where the marine sediment was not encountered within the final excavation level. 1 sampling grid for EVT is subject to be sampled in future reporting period. The marine sediment sampling works to the western portion of T2C have not been undertaken and are subject to future development programme at this area. The zoom in figure for the presentation of grid areas of EVT and T2C is shown in Figure 2.3c. The summary of sampling results is shown in Appendix E.
2.4.3.1.3
APM / BHS Tunnel and Ancillary Building with
Piled Foundations
The APM / BHS Tunnel and Ancillary Building with Piled Foundations is covered by contract 3802. There were 33 numbers of sampling grid and 3 sampling layers with Arsenic exceeding RBRGs limits were recorded. There were no sampling works at 1 sampling grid where the marine sediment was not encountered within the final excavation level. The zoom in figure for the presentation of grid area of APM / BHS Tunnel and Ancillary Building with Piled Foundations is shown in Figure 2.3d. The summary of sampling results is shown in Appendix E.
2.4.3.2
Areas
without Ground Improvement Works by Deep Cement Mixing
For the marine sediment to be generated from the areas without ground improvement works by DCM (i.e., existing airport island area, construction berth at Area C5 of the reclaimed land area and approach light area), the excavated marine sediment was treated with cement and tested against the TCLP limits as provided in Table 2.14. The testing frequency was the same as that described in Section 10.5.1.14 of the approved EIA Report, which has been provided in Section 2.4.3.1. The treated sediment was tested against relevant engineering requirements to confirm their suitability as backfilling material for respective areas of different future uses. The UCS was also tested and defined based on respective engineering requirements.
2.4.3.2.1 Construction Berth at Area
C5 of the Reclaimed Land Area
A construction berth was constructed at the eastern portion of newly reclamation area. During the installation of casing, approximately 99m3 of marine sediment was generated and treated with cement stabilisation. The treated sediment were then tested against the TCLP limits as given in Table 2.14 and no exceedance of TCLP limits was recorded. The location of marine sediment generated and the backfilling location of treated marine sediment are shown in Figure 2.4.
2.4.3.2.2 T2 Foundation and
Substructure Works
The excavated volume of marine sediment was about 60m3 and treated with cement stabilisation. Two treated marine sediment samples were collected and tested against the criteria for reuse of treated sediments with reference to the UTS, which specify the TCLP test limits as given in Table 2.14 and no exceedance of RBRGs was recorded. The location of generated marine sediment and the backfilling location of treated marine sediment are both shown in Figure 2.4.
2.4.3.2.3 Approach Light Area
Marine sediment would be generated from the construction of the approach light at the east and west of the new third runway as shown in Figure 2.4. For the marine sediment generated from this area, the sampling works, the treatment works, TCLP testing works and backfilling of the treated marine sediment were completed and finalised in early 2022. Therefore, all the relevant treatment details would be reported in the next annual EM&A report.
2.5
Chinese White Dolphin
According to Sections 10.2.1.2 and 10.2.1.3 of the EM&A Manual, CWD monitoring is required during the baseline, construction, post-construction and operation phases of the project. The aims of CWD monitoring during construction period are:
· to monitor the effects on the potential shift in the CWD travelling areas and habitat use;
· to monitor the effectiveness of the HSF speed and routing restrictions to the CWDs;
· to provide a dataset that can be compatible with the AFCD long-term monitoring, be stratified in such a way as to allow the calculation of density and abundance for the different phases and to calculate the trends from these estimates; and
· to provide assessment of how the project and cumulative effects may be impacting the CWDs.
This section summarises the results of the CWD construction phase monitoring effort over a 12-month period from January 2021 through December 2021, to gather information on the spatial and temporal distribution patterns as well as calculate density and abundance of CWD in western Hong Kong waters. Supplementary information collected focusing on northwestern Lantau waters, including habitat use and behaviours of CWD during the construction phase of the Project, has also been reviewed.
This reporting period is effectively the fifth full year of construction phase monitoring of CWDs. The overall monitoring programme commenced in August 2016, although there were no marine construction works in August and September 2016, and only localised sand blanket laying and DCM trial works from October to December 2016. This annual report reviews the construction phase monitoring data for 2021 and compares it with the construction phase monitoring data for the previous years.
CWD monitoring was conducted by undertaking vessel line-transect surveys, supplemented by land-based theodolite tracking survey and Passive Acoustic Monitoring (PAM). The vessel line transects covered Northeast Lantau (NEL), Northwest Lantau (NWL), Airport West (AW), West Lantau (WL) and Southwest Lantau (SWL) areas at a frequency of two full surveys per month as proposed in Section 10.2.3.2 of the Updated EM&A Manual, which are consistent with the AFCD long-term monitoring programme (except AW). The locations of the CWD vessel survey transects are shown in Figure 2.5. Additional survey effort was collected on a voluntary basis at the same frequency of two surveys per month from Deep Bay (DB) (refer to Appendix F for the location of this additional survey), which is an area that historically had CWD in the outer bay, to establish a full understanding of CWD abundance. All the DB data were considered supplemental and were only used for density and abundance estimation.
Density and abundance analysis made use of both conventional distance sampling (CDS) and a more sophisticated approach – multiple covariate distance sampling (MCDS) to estimate CWD abundance for the waters of Hong Kong. The additional analysis using MCDS is more time-consuming and labour-intensive than CDS as it uses information on environmental factors that are likely to affect detection probability (such as variables describing sighting conditions) and generally produces estimates with higher precision (i.e., lower variances and CVs) (Marques and Buckland, 2003 & 2004). However, datasets with small sample sizes (such as often occur in marine mammal studies) can make it difficult or impossible to achieve model “convergence” in some MCDS analyses, and thus it is critical to always start each analysis with CDS methods (this also helps to determine the appropriate truncation distance and overall modelling approach).
Based on the vessel survey data, seasonal differences in dolphin density and use of the study area were examined, using the solar seasons (Winter: December-February, Spring: March-May, Summer: June-August, Autumn: September-November) and/or oceanographic seasons (Dry: October-March, Wet: April-September).
The travelling pattern in different areas were reviewed by using photo-identification of individual dolphins and their re-sighting locations, depicting the range use and cross-area movement of re-sighted individuals, where practicable. Travelling of CWDs in the north of Lung Kwu Chau were particularly supplemented with information from land-based theodolite tracking survey findings.
For the land-based theodolite tracking surveys, the monitoring frequency during the construction phase for marine works was one day per month at both the Lung Kwu Chau (LKC) station and Sha Chau (SC) station, as stipulated in Section 10.2.3.4 of the EM&A Manual. PAM was also deployed for the construction phase with data supplementing the results of both vessel and land-based surveys. For details on CWD monitoring and data analysis methodologies refer to Section 10.2.4 of the EM&A Manual. The locations of land-based survey stations are described in Table 2.16 and depicted in Figure 2.6. The location of the Passive Acoustic Monitoring device at A5 (with the coordinates of 22° 20.299’ N, 113° 53.871’ E) is shown in Figure 2.7.
Table 2.16: Land-based Survey Station Details
|
Stations |
Location |
Geographical Coordinates |
Station Height (m) |
Approximate Tracking Distance (km) |
|
D |
Sha Chau (SC) |
22° 20’ 43.5” N 113° 53’ 24.66” E |
45.66 |
2 |
|
E |
Lung Kwu Chau (LKC) |
22° 22’ 44.83” N 113° 53’ 0.2” E |
70.40 |
3 |
2.5.1
Action and Limit Levels
The Action Level and Limit Level for CWD monitoring were formulated by an action response approach using the running quarterly dolphin encounter rates (Encounter Rate by Number of Dolphin Sightings ‘STG’ and Encounter Rate by Number of Dolphins ‘ANI’) derived from baseline monitoring data covering six months from mid-December 2015 to June 2016, as presented in the CWD Baseline Monitoring Report. The derived values of Action and Limit Levels for CWD monitoring are shown in Table 2.17. Running quarterly encounter rates STG and ANI have been determined for each month since August 2016 to compare with the derived Action/limit levels for construction phase monitoring of CWD. If persisting declines in the CWD running quarterly encounter rate values are determined month on month, an appropriate short-term response is then possible if the decline is shown to be related to 3RS construction activity.
Table 2.17: Derived Values of Action Level and Limit Level for Chinese White Dolphin Monitoring
|
|
NEL, NWL, AW, WL and SWL as a Whole |
|
Action Level(1) |
Running quarterly STG < 1.86 & ANI < 9.35 |
|
Limit Level(1) |
Two consecutive running quarterly (3-month) STG < 1.86 & ANI < 9.35 |
Notes: (1) Action Level and/or Limit Level will be triggered if both STG and ANI fall below the criteria
2.5.2
Summary of Monitoring Results
2.5.2.1 Summary of Vessel Line-transect Survey
Monitoring Results
2.5.2.1.1 Survey Effort
During the reporting period from January 2021 through December 2021, surveys were completed in Northeast Lantau (NEL), Northwest Lantau (NWL), Airport West (AW), West Lantau (WL), and Southwest Lantau (SWL) survey areas. Although the frequencies of visiting each survey area per survey month were identical, the survey effort of different areas varied and was generally in proportion to the size of each survey area (i.e. larger survey area having longer distance of survey effort). A total of around 5,368.2 km survey effort was collected in this reporting period.
Around 87.2% (around 4,681.5 km) of the survey effort was collected under favourable weather condition (i.e. Beaufort 0-3 and visibility of approximately 1200 m or beyond), and can be utilized in analyses of encounter rates, density and abundance.
The breakdown of the survey effort by survey areas is tabulated in Table 1 of Appendix F. A detailed record of the survey effort data is also provided in Appendix F.
2.5.2.1.2 Sighting Distribution
During the reporting period, a total of 151 groups consisting of 493 CWDs were sighted in NWL, WL and SWL survey areas. Amongst these 151 groups of CWDs, 147 groups with 486 CWDs were sighted during on-effort surveys under favourable weather condition (Beaufort 0-3 and visibility of approximately 1200 m or beyond). Breakdown of the sightings by survey areas are tabulated in Table 2 of Appendix F.
In NWL (including AW transects), CWDs were mainly sighted within and around the SCLKCMP, particularly in northern and northeastern waters off Lung Kwu Chau. More sightings were recorded around the SCLKCMP compared to 2020 in which only a few sightings scattered around Lung Kwu Chau. Several sightings were also recorded at the west of the existing Hong Kong International Airport. No sighting was recorded within the 3RS temporary works area.
In WL, CWD sightings were recorded on almost all transects. The sightings were distributed quite evenly over the entire survey area between the Hong Kong-Zhuhai-Macao Bridge Hong Kong Link Road (HZMB-HKLR) and Fan Lau.
In SWL, sightings of CWD were mostly recorded in between waters off Shek Pik and Fan Lau, with relatively more sightings in the east side. Only two groups of CWD were spotted around the Soko Islands.
No CWDs were recorded in NEL survey area. The sighting locations of CWDs during this reporting period are depicted in Figure 1 of Appendix F.
2.5.2.1.3 Encounter Rates
Two types of dolphin encounter rates were calculated based on the data collected during the reporting period. They included the number of dolphin sightings per 100 kilometers survey effort (STG) and total number of dolphins per 100 kilometers survey effort (ANI). The dolphin encounter rates were calculated by using survey data collected under favorable weather condition only (Beaufort sea state 3 or below with favorable visibility). Encounter rate provides a short to medium term frequency method for monitoring and responding appropriately to changes in CWD abundance as project works progress (referring to Section 10.5.2.3 of the EM&A Manual). The two types of encounter rates provide an overall indication of changes in CWD numbers over time in western Hong Kong waters.
During the reporting period, the overall combined STG and ANI of CWDs (from NEL, NWL, AW, WL and SWL) in 2021 were 3.14 and 10.38 respectively. Dolphin encounter rates by survey area and a summary of monthly encounter rates are presented in Table 3 and Table 4 of Appendix F respectively. Compared by area, WL had the highest encounter rates STG and ANI amongst the survey areas, followed by SWL and then NWL.
The temporal trends in 2021 overall exhibited typical seasonal patterns. The peak monthly STG and ANI occurred in July but exceptionally dropped to the lowest in August in the same season (summer). The trend is quite similar to that of last year (lowest in September) but again a bit different from earlier years, in which the lowest encounter rates were usually recorded in wintertime. The trends of both monthly STG and ANI are presented in Figure 2 and Figure 3 of Appendix F.
Running quarterly encounter rates STG and ANI data were determined for each month for comparison with the Action/Limit levels for construction phase monitoring of CWD. Although the running quarterly ANI has fallen below the Action Level in April, May, June, October and December 2021, the overall Action Level was not triggered in this reporting period because the running quarterly STG of those months remained above the Action Level. The Limit Level was not triggered during this reporting period as there were not any two consecutive running quarterly STG and ANI falling below the Action Level. The running quarterly STG and ANI from January to December 2021 are summarized in Table 4 of Appendix F. The graphical plots of running quarterly encounter rates of the current reporting year and the past reporting years are presented in Figure 2 and Figure 3 of Appendix F respectively.
2.5.2.1.4 Density and Abundance Estimation
Line transect analyses to estimate the density and abundance of CWDs in Hong Kong waters during the reporting period were conducted using the same basic methods as in previous analyses. The best estimate of abundance was obtained using Beaufort sea state as a co-variate, and a half-normal model with a cosine adjustment (effective strip width = 253 m). The detection function of 3RS CWD monitoring data of this reporting period is shown in Figure 4 of Appendix F and the various parameters of the 2021 estimates are shown in Table 5 of Appendix F. The overall abundance estimated for this reporting period (incorporating an entire year of data from all four seasons) was 34 CWDs (CV = 15.5%, indicating a good level of precision <20%). This shows a small, but notable increase from last year. For comparison, the 2020 abundance was 32 CWDs (CV = 12.8%). As in analyses of the last reporting year, the area with the highest abundance and highest density in 2021 was WL (N=21, this has been consistent over the AFCD long-term records). NWL showed a substantial increase in the numbers of dolphins (from 1 in 2020 to 4 in 2021), though SWL showed a drop (from 11 to 7). NEL registered an abundance of zero, which has been the case in most of the last 10 years. Overall, the number of dolphins was similar, though a bit up from last year. This may be indicative of the start of some recovery, after dolphins moved away from the works area in past years. The drop in numbers since about 2010 is thought to be partly related to the impacts from the construction of the Hong-Kong-Zhuhai-Macao Bridge (HZMB). The HZMB impacts on dolphins would be expected to have been most severe between 2013-2016 (when the brunt of construction was occurring), and in fact, this time period saw a significant drop in numbers of dolphins in Hong Kong (see Jefferson 2018). Though this will require further examination, the increase is consistent with what was predicted in the 3RS EIA.
It is worth noting, however, that the 3RS EIA predicted significant impacts on CWDs (Mott MacDonald 2014), and a drop in numbers of dolphins in the area during the most intensive part of the 3RS construction phase is thus expected. Reclamation filling works was substantially completed in 2021(1), so there is expected to be some recovery now that the main marine filling and reclamation works have been completed. However, this issue will need to be examined with more data over several years, and the cumulative impacts due to the 3RS project with other concurrent projects (reclamation works near Tung Chung in recent years, for instance) will become clearer as works progress, and as our dataset grows.
In addition to estimating year-round abundance for each of the survey areas, a seasonal analysis was also conducted (the pooled dataset from all survey areas was used, as stratifying by both survey area and season would reduce the sample sizes that result in estimates with unacceptably low levels of precision) (refer to Table 5 of Appendix F). The spring estimate was the lowest (N=31 dolphins), which has traditionally been the case for dolphin numbers in Hong Kong. The autumn estimate showed the highest numbers (N=43 dolphins), which is also expected based on historical records. The seasonal analysis shows that, as in the past, there was a marked influx of dolphins into Hong Kong during the wet season (especially in summer and autumn months).
2.5.2.1.5 Quantitative Grid Analysis on Habitat Use
Habitat use amongst the survey areas was examined by using quantitative grid analysis, both SPSE (no. of on-effort sightings per 100 units of survey effort) and DPSE (no. of dolphins per 100 units of survey effort) values for each 1 km2 grid were calculated in all grids amongst all survey areas for the period from January 2021 to December 2021. SPSE and DPSE of the current reporting year and the previous reporting years are depicted in Figure 5 of Appendix F.
In 2021, CWDs’ usage of waters around SCLKCMP in NWL increased slightly after a continuous decline in previous years between 2018 and 2020.
The important dolphin habitats in WL survey area in 2021 are largely similar to 2020 with slightly decreased use of waters around Peaked Hill and the relatively offshore waters between Peaked Hill and Fan Lau; grids with high SPSE and/or DPSE value(s) in WL were near Tai O, Yi O, Peaked Hill and Fan Lau.
In SWL, there was a continuous decline in CWDs’ usage of waters around the Soko Islands since 2020 while the waters around Fan Lau remained used by CWDs frequently.
Cumulative SPSE and DPSE values were also calculated by using the 3RS CWD monitoring data since mid-December 2015 and are depicted in Figure 6 of Appendix F. Grids in western waters of Hong Kong with higher dolphin density are restricted to waters off West Lantau, at Tai O, Yi O, Peaked Hill and Fan Lau.
2.5.2.1.6 Group Size
During the reporting period from January 2021 to December 2021, group size of CWDs ranged from one to 13 dolphins, with an average of 3.26, taking into account all CWD sightings recorded. The average group sizes of NWL, WL and SWL were 3.58, 3.40 and 2.78 respectively. By four solar seasons, the average group size of CWDs was the highest in winter (3.76) but the lowest in spring (2.67). The summaries of the average group size of CWDs by survey area and by season are presented in Table 6 and Table 7 of Appendix F.
The number of small-sized (i.e. 1 to 2 dolphins per group) and medium-sized CWD groups (i.e. 3 to 9 dolphins per group) were the same, both accounted for around 48.3%. Five sightings, which accounted for 3.3% of all sightings, were large CWD groups with 10 or more dolphins per group.
Both small and medium CWD groups were generally sighted throughout the distribution range of dolphins in NWL, WL and SWL waters, except the observation that medium-sized group was absent from the southern part of NWL survey area. Large-sized CWD groups were recorded in WL survey area and surprisingly encountered for three times in NWL survey area, where large sized CWD groups were absent for recent years. The sighting distribution of CWDs with different group sizes is illustrated in Figure 7 of Appendix F.
2.5.2.1.7 Activities and Association with Fishing Boats
Although vessel surveys do not provide the most unbiased information on the behaviour and activities of dolphins (due to the potentially disturbing presence of the vessel itself, and also the low vantage point of small vessels), nonetheless behaviour and activity data are still useful and are being collected from the vessel surveys.
During the reporting period, a total of 41, 20, 26 and 5 groups of CWDs were observed engaging in foraging, travelling, socialising and resting/milling activities, comprising of 27%, 13%, 17% and 3% of all CWD sightings respectively. The sighting locations of CWD groups engaged in different types of activities are depicted in Figure 8 of Appendix F while the percentages of different activities for each of the survey areas are shown in Table 8 of Appendix F.
In NWL, foraging activities occurred within and outside SCLKCMP, and also off the Lantau coast. Socialising activities were observed mainly around Lung Kwu Chau, with one sighting off Lantau. It is observed that travelling activities were only recorded around Lung Kwu Chau. A group of milling/resting dolphins was observed off northwest Lung Kwu Chau.
In WL, foraging and socialising activities of CWD mainly occurred in the waters off Tai O, between Yi O and Peaked Hill and at Fan Lau. Travelling activities were recorded throughout the WL survey area, while milling/resting activities were recorded only around Peaked Hill. In SWL, most of the sightings with observed activities were in foraging and these sightings were scattered.
A total of 13 sightings of CWDs were observed associating with operating fishing boats, including gill netters (four groups), purse seiners (eight groups) and shrimp trawler (one group), accounting for 9% of all sightings in 2021. CWDs’ association with operating fishing boats in 2021 continued to show a rebound compared with the observable declining trend in previous years (7.2% in 2016, 6.3% in 2017, 3.7% in 2018, 2.4% in 2019, 3.6% in 2020).
Observations of CWD association with operating fishing boats were scattered in WL and SWL, with more observations recorded near Fan Lau and Fan Lau Tung Wan. There was no observation of CWD association with operating fishing boats in NWL, where Lung Kwu Chau was an area that used to be a favourite fishing ground in earlier years. Although a trawling ban was implemented in December 2012, illegal trawling activities were still observed near the western and southwestern borders of Hong Kong. One group of CWDs was observed foraging in association with shrimp trawlers near the Hong Kong border in WL. The sighting locations of CWD groups associated with operating fishing boats are depicted in Figure 9 of Appendix F.
2.5.2.1.8 Mother-calf / Mother-unspotted Juvenile Pairs
During the reporting period, a total of 32 sightings were observed having mother-and-unspotted calf (UC), mother-and-unspotted juvenile (UJ) and/or mother-and-mottled pairs, which accounted for about 21.2% of all sightings of 2021. The percentage was higher than that of 2020 (16.3%). For different survey areas, the percentages of sightings with mother-calf pairs in NWL, WL and SWL were 29.2%, 24.1% and 10.0% respectively. These percentages were calculated by dividing the number of sightings with mother-calf pairs of a survey area by the total number of sightings of that survey area. In 2021, an observable increase in number of sightings with mother-calf pairs in NWL (including AW) was encountered after the drastic drops from 2018 to 2020 (from one sighting in 2020 to seven sightings in 2021).
The abovementioned 32 sightings included one pair of mother-and-UC, 38 pairs of mother-and-UJ and three pairs of mother-and-mottled. According to the result of photo-identification, a total of nine mother-calf pairs were successfully identified from these 32 sightings.
Most of the sightings with mother-calf pairs were recorded in WL between Tai O and Peaked Hill. In NWL, sightings with mother-calf pairs were mostly recorded around SCLKCMP. In SWL, sightings with the presence of mother-calf pairs occurred in relatively offshore waters of Fan Lau and Fan Lau Tung Wan. The sighting distribution of mother-calf pairs is depicted in Figure 10 of Appendix F.
2.5.2.1.9 Photo Identification – Summary
During the reporting period, a total of 14 newly identified CWD individuals were added to the photo-identification catalogues, including seven animals added to NL catalogue and another seven added to WL catalogue. One animal, namely NLMM037 was confirmed to be a duplicate of identified individual (i.e. NLMM009) in earlier time. Therefore, all records under this duplicate were transferred to the records under NLMM009.
In 2021, a total of 112 CWD individuals were identified for altogether 327 times from all sightings. Amongst these 112 CWD individuals, 23, 63 and 26 belonged to NL, WL and SL catalogues respectively. There were 68 individuals (around 60.7%) that were sighted more than once. Twenty of these 68 re-sighted individuals were sighted five times or more.
The most frequently re-sighted animal in 2021 was SLMM037, which was sighted 15 times, followed by SLMM014 and SLMM003 (being re-sighted 13 times and 10 times respectively). The most frequently re-sighted animal since the establishment of the photo-identification catalogue is SLMM014 which has been sighted 55 times, followed by SLMM003 (sighted 48 times), SLMM010 (sighted 44 times), SLMM037 and WLMM001 (both sighted 41 times). There are few more animals including WLMM079, WLMM043, WLMM007, SLMM012, SLMM052, SLMM007 and WLMM027 that have been sighted 30 times or above.
Fifteen animals that were frequently using Hong Kong waters in previous years (with 10 or more re-sighting records since commencement of the monitoring in mid-December 2015) have disappeared from our sighting records in 2021 (note that these dolphins may still be using Hong Kong waters, but may have not been detected on our surveys). These animals are NLMM002, NLMM006, NLMM010, NLMM014, NLMM018, NLMM019, NLMM043, SLMM002, SLMM011, SLMM015, SLMM017, SLMM028, SLMM053, WLMM060 and WLMM078. Some of these individuals (i.e. NLMM002, NLMM006, NLMM010, NLMM018, SLMM015, SLMM017 and WLMM078) have not been seen in Hong Kong waters for two or even more years. We could not confirm if these animals were occurring elsewhere in mainland waters, or if some of them have already passed away. Information of the photo-identification work of CWDs taking place in mainland waters by South China Sea Fisheries Research Institute (SCSFRI) is not available for our further investigation of these animals. On the other hand, AFCD’s stranding information on dolphin carcasses might not be able to provide useful information for our further investigation as many of the dolphin carcasses are seriously decomposed when they were found. Special attention will be paid on these animals in the future photo-identification analysis to see if there are any updates of their occurrence.
NLMM013 and its offspring NLMM006 (a mottled individual), the particular mother-calf pair with prolonged bonding in NWL waters as mentioned in previous years, were not seen together after their last pairing record in December 2019. NLMM013 was still being sighted for four times in NWL in 2021, but its offspring NLMM006 has not been recorded again since the last sighting with its mother in 2019. In this regard, the prolonged mother-calf bonding is believed to be concluded.
In previous years, special attention had been given to SLMM028, which had a severe injury in 2018. It showed good signs of recovery from its serious injury with normal foraging behaviour recorded 2019 and 2020, however, it was not sighted during vessel surveys in 2021.
A summary of the photo-identification of CWDs is presented in Table 9 of Appendix F.
2.5.2.1.10 Photo Identification – Range Use of Identified CWD
individuals
SLMM037, the most frequently re-sighted animal in 2021 and also the 4th most frequently re-sighted animal since mid-December 2015, continued to occur frequently in WL and SWL waters. Compared with year 2020, its range use continued to shrink in SWL from the Soko Islands to the western waters of the SWL survey area around Fan Lau and Fan Lau Tung Wan. The overall range use of SLMM037 has covered from Tai O to east of the Soko Islands.
SLMM014, the most frequently re-sighted animal since mid-December 2015, reduced its range use in waters between Tai O and the Hong Kong International Airport. It also continued to show a reduction of use of waters around the Soko Islands compared with earlier years. The overall range use of SLMM014 since the first identification of this animal has recorded a wide coverage from western waters of the Hong Kong International Airport in NWL to Lo Kei Wan in SWL.
In 2021, the range use of SLMM003, the second most frequently re-sighted animal since mid-December 2015, continued to shrink in SWL compared with previous reporting years. Its range use in SWL shifted a bit more westward than 2020. In general, SLMM003 appeared extensively from Peaked Hill in WL to Fan Lau in SWL.
SLMM010, the third most frequently re-sighted animal since mid-December 2015, was more frequently sighted in WL than in SWL in 2021 compared with previous years, and continued to extend its range use in northern part of WL survey area. Meanwhile, its range use in SWL appeared to shrink drastically, with only one re-sighting record there in 2021.
The most frequently re-sighted mother-calf pair in 2021 was NLMM015 and its offspring WLMM164. The calf WLMM164 was first sighted in June 2021 in WL. They have been successfully identified together for six times in 2021. This mother-calf pair has a wide range use covering Lung Kwu Chau in NWL, and Tai O, Yi O and Fan Lau in WL while the mother NLMM015 inhabits in NWL, WL and SWL survey areas from Lung Kwu Chau to the Soko Islands.
The sighting locations of SLMM037, SLMM014, SLMM003, SLMM010, NLMM015 and WLMM164 are depicted in location maps under Figure 11 of Appendix F, which provide the indicative distribution range use of representative individuals recorded for the 3RS CWD monitoring.
2.5.2.1.11 Photo Identification – Cross-area Movement
Amongst the 68 individuals that were re-sighted more than once in 2021, 45 individuals showed cross-area movement between survey areas. This accounted for about 40.2% of all 112 identified animals in 2021. Amongst these 45 animals, 16 animals (35.6%) were re-sighted in both NWL (including AW) and WL, 24 animals (53.3%) were recorded in both WL and SWL. There were five animals (11.1%) namely SLMM030, WLMM001, WLM065, WLMM067 and WLMM079, which were recorded occurring in all three main survey areas (WL, SWL and NWL) in 2021. In total, there were 21 identified individual showing cross-area movement that involved NWL. This shows a remarkable increase compared to 2020 when only eight identified individuals were recorded showing cross-area movement involving NWL. This is in line with the fact that more sightings were recorded in NWL in 2021 compared to 2020.
2.5.2.1.12 Photo Identification – Residency Pattern
The residency patterns of the dolphin individuals identified under this monitoring programme have been examined. For residency pattern analysis, both seasonal and annual occurrence patterns of identified CWD individuals with 15 or more re-sighting records (since the establishment of the photo-identification database) were carefully examined. “Residents” are defined as individual dolphins that were regularly sighted for at least three consecutive years, while “Visitors” are individuals that were intermittently sighted during the past years since the establishment of the photo-identification database. Seasonal occurrence patterns were examined to distinguish individuals that occurred year-round (i.e. individual dolphins sighted in all four seasons in at least one of the last two years) or seasonally (i.e. individual dolphins that occurred only in certain seasons of the year).
Up to year 2021, photo-identification records of 51 dolphin individuals that have at least 15 re-sightings since the establishment of the database were examined. There are eight and 42 individuals being defined as year-round residents and seasonal residents respectively. Only one out of these 51 individuals is considered as a visitor to Hong Kong waters. However, it should be noted that the low number of dolphins being classified as visitors at present is mainly because of difficulty for visitor dolphins to meet the minimum requirement of at least 15 re-sightings with their intermittent sighting records. The details of the residency pattern of these 51 animals are shown in Appendix F.
2.5.2.2
Summary of Land-based Theodolite Tracking Monitoring Results
In this reporting period, land-based surveys commenced on 15 January 2021, and concluded on 20 December 2021. A total of 24 days and 144 hours of land-based theodolite survey effort were accomplished, including 12 days and 72 hours from LKC and 12 days and 72 hours from SC (Table 10 of Appendix F for summary). A total of 16 CWD groups were tracked from land, for a total of 3.11 hours, all from the LKC station (Table 10, Figure 12 Appendix F). While most initial CWD sightings were within 1.0 km of the LKC tracking station, sightings were as far out as 5.1 km, northwest of the station. The number of CWD groups sighted from LKC per survey hour was 0.22, compared to 0.29 in 2020, 0.33 in 2019, 0.77 in 2018, and 0.89 in 2017. No CWDs were observed from SC.
After the raw data were filtered, only 8 CWD group tracks off LKC fit criteria for movement analyses, due to the majority of CWD group tracks being too short in duration (< 10 minutes) to include. From the tracks that fit criteria, only 13 10-minute short-track segments could be extracted for potential analyses. Based on this information, sample sizes were simply too low for appropriate statistical analyses, and therefore the present data are summarized to show potential trends. Due to low sample size, all data were used to summarize diurnal, annual, and group size patterns and behavioural state activity. Filtered standardized short-track segments were used to summarize movement patterns, similar to 2020 data analysis.
2.5.2.2.1
Time of Day
The diurnal pattern of CWDs was calculated by dividing the total tracking time of CWD groups (prior to filtering short-track data) by the total effort per hour block, and depicted in Figure 13 of Appendix F. Off LKC, the highest proportion of CWD tracking time per hour of effort was recorded during the 1400 hour block (8.4%), the 1300 hour block (6.4%), and the 1100 hour block (5.8%) whilst the lowest percentages were recorded in the early morning and during the 1200 hour block (<3% each).
2.5.2.2.2
Time of Year
CWDs were observed from LKC during January, February, April, July, October, November, and December as depicted in Figure 14 of Appendix F. Similar to 2020, no groups were recorded from LKC during five months in 2021, including March, May, June, August, and September. Based on solar season in 2021, CWDs were observed most often during the winter (50%), and least often during the summer (6%). Similarly in 2020 and 2019, CWDs were observed more than expected, based on even distribution, during the winter season. In 2021, CWDs were observed most often during the dry season (75%) and least often during the wet season (25%). The same pattern was observed in 2020 and 2018; however, in 2019 there was not a statistical difference based on oceanographic season.
2.5.2.2.3
Group Size
The mean group size of CWDs off LKC prior to filtering tracks was 3.0±1.8, ranging from singletons to a maximum group size of seven dolphins (Table 11 of Appendix F). Group size was 1.8±0.9 in 2020 (range 1-4), 1.9±1.2 in 2019 (range 1-6), and 2.6±1.5 in 2018 (range 1-8). Based on solar season, the mean CWD group size in descending order was 4.0±1.9 in autumn (range 2-7), 2.6±1.8 in winter (range 1-7), 2.5±2.1 in spring (range 1-4), and 2.0 in summer. Based on oceanographic season, the mean CWD group size was 4.3±2.1 (range 2-7) during the wet season and 2.6±1.6 (range 1-7) during the dry season.
Based on proximity to the SCLKCMP boundary, the mean CWD group size was 4.8±2.2 (range 2-7) inside the marine park, 2.3±1.5 (range 1-4) when crossing the marine park, and 2.1±0.6 (range 1-3) outside the marine park. The sighting distribution of CWDs relative to group sizes within the SCLKCMP, crossing the SCLKCMP boundary and outside the SCLKCMP are represented in Figure 15, Figure 16 and Figure 17 of Appendix F respectively.
2.5.2.2.4
Behavioural State
The unknown behavioural category (50%, n=131) was excluded from the following summary of behavioural states. CWDs were recorded travelling (42%), foraging (28%), milling (22%), socialising (5%), and resting (3%) of theodolite tracking time, prior to filtering tracks (Figure 18 of Appendix F). Resting and milling behaviour were not recorded off LKC in 2020.
Within the boundary of the SCLKCMP, observed CWD behavioural states included travelling (81%, n=42), socialising (11%, n=6), and resting (8%, n=4) (Figure 19 of Appendix F). Outside of the SCLKCMP, observed CWD behavioural states included foraging (51%, n=26), milling (41%, n=21), and travelling (8%, n=4). CWDs crossing the SCLKCMP boundary were recorded foraging (41%, n=11), milling (26%, n=7), and travelling (33%, n=9).
2.5.2.2.5
Movement Patterns and Vessel Activity
Plots of vessels, including high-speed ferries, and CWDs show overlap in habitat off LKC throughout the year (Figure 20 of Appendix F).
Off LKC in 2021, 119 vessels were recorded during theodolite tracking surveys. Only six vessels were recorded within 500m of dolphins (based on filtered short-track segments) which included a container ship, fishing boats, a government boat, and a HSF. Mean speed, reorientation rate and linearity for CWDs in the absence of vessels and in the presence of vessels are detailed in Table 12 of Appendix F.
2.5.2.2.6
Summary of findings for 2021
● Similar to 2020, data collected in 2021 provided few samples and the inability to conduct robust statistical analyses. While low numbers make most statistical analysis not possible, it is nevertheless clear that off LKC there continues to be a strong decrease of CWDs compared to earlier years.
● The number of CWD groups sighted from LKC per survey hour was 0.22, compared to 0.29 in 2020 and 0.33 in 2019, less than one-half of that observed in 2018 (0.77 groups per survey hour) and 2017 (0.89 groups per survey hour).
● CWDs were observed most often during the late morning and early afternoon hours (1100, 1300, and 1400 hour blocks). This pattern differed from 2020, when CWDs were observed most often during the 0900 morning hour block and almost none observed after noon.
● The highest percentages of CWDs were observed during the late autumn and early winter seasons, similar to 2020 and 2019 with high percentages during winter.
● Similar to 2020, CWDs were recorded most often during the dry season, with a peak in January. No CWDs were observed during 3 of the 5 wet season months, and 2 of the 7 dry season months.
● Maximum CWD group size in 2021 was 7 individuals, compared to 2020 with a maximum of 4 individuals, 2019 with a maximum of 6 individuals, and 2018 with a maximum of 8 individuals.
● Overall, waters off Lung Kwu Chau were primarily used for travelling, foraging, and milling, which is similar to the high percentage of travelling and foraging observed in 2020.
● Most CWD groups were observed outside of the SCLKCMP boundary, which differs from 2020 when most groups were observed inside of the marine park. Group sizes were larger inside of the SCLKCMP boundary and smaller outside of the marine park.
● Travelling, socialising, and resting were observed within the SCLKCMP boundary; foraging, travelling and milling were observed by CWDs crossing the SCLKCMP boundary; and foraging, milling, and travelling were observed outside of the SCLKCMP boundary. In 2020 the pattern was quite different, with foraging observed within the park boundary and only travelling observed outside of the park boundary.
● Only six vessels were recorded within 500m of CWD groups in 2021, which may be due to low sample size or reflect potential CWD avoidance of vessels off LKC.
● There were no sightings of CWDs off Sha Chau during land-based theodolite work in 2021 (same as 2020).
2.5.2.3 Summary of Passive
Acoustic Monitoring (PAM) Results
2.5.2.3.1
Dolphin Detection per Day
During 30 December 2020 to 10 January 2022, there were six deployment periods of F-POD and/or C-POD at position A5 for PAM (with the coordinates of 22° 20.299’ N, 113° 53.871’ E). During the deployment period, CWDs were detected at Location A5 with a total of 74 true dolphin Detection Positive Minutes (DPM), as summarised in Table 13 of Appendix F. Dolphins were detected on 19 of 280 days with recording effort (Figure 21 of Appendix F).
The activity of CWDs was represented by the percentage of Detection Positive Days (DPD) over total logged days (i.e. DPD %). Over the six deployment periods, DPD % ranged from 0% to 13.07%, while the presence of CWD was detected in overall 6.79% of the logged days (as summarised in Table 13 of Appendix F). Low dolphin activity was recorded from PAM at Location A5 throughout deployment periods in 2021.
In terms of solar season, no DPM was recorded in two winter months and springtime, while low DPM was recorded from late summer to mid-autumn as illustrated in Figure 21 of Appendix F. Higher levels of dolphin DPM were recorded from late autumn to mid-winter. The zero detection from January to February was due to technical issues experienced by the PAM device, which was found being adversely displaced from A5 position by external force. Low detection rates in summer may be an artefact of low recording effort during summer months (deployment #4) due to a similar issue that the device was found being burrowed in mud while its frame was turned upside down, indicating that it was probably shifted by another boat/net.
2.5.2.3.2 Dolphin Diel
Pattern
Dolphin detection rates at A5 were greater overall at night than during daytime, with a peak in detections in the 0200 time block and remaining high in the hour 0300 and 0600 blocks (as indicated in Figure 22 of Appendix F). The higher night-time detection rate observed during this monitoring period is similar to the diel pattern in dolphin detections observed throughout Hong Kong waters, with higher numbers of detections during night-time and fewest detections at midday (Munger et al. 2016). Dolphin detections in autumn and winter showed a consistent trend where peak detections occurred in the 0200 block (Figure 23 of Appendix F). In autumn, apart from peak hours from 0200 to 0600, dolphin acoustic activities were also recorded in the evening from 1700 to 2100. As dolphin detections were low in spring and summer, there were no observable diel patterns.
2.5.3 Discussion on CWD Monitoring
Results
CWD monitoring by vessel surveys has been conducted as required during the construction phase. Supplementary surveys including land-based theodolite tracking and underwater passive acoustic monitoring have provided additional information (such as habitat use of CWDs during day and night) for facilitating a review of the effectiveness of mitigation measures proposed and any need for adaptive management measures. In addition to interpreting monitoring data in relation to identifying any project impacts, the interpretation of data from all three monitoring types can also assist in examining the kinds of issues that need to be considered for management and conservation of CWD in Hong Kong.
2.5.3.1 Vessel
Line-transect Survey and Photo-identification
From the CWD vessel-based monitoring data, the estimate of overall abundance for 2021 was 34 dolphins, which is slightly higher than the year before, with a CV of 15.5% (which indicates a good level of precision). It is not surprising to see that the estimate of total dolphin numbers in Hong Kong was a bit higher than the previous year’s estimate (32 dolphins in 2020, CV = 12.8%), though a change from one year to the next should never be taken as an indication of long-term trends. Although CWD estimates in Hong Kong increased somewhat from 2016 to 2018 (Jefferson 2018; 3RS Annual EM&A Report 2018), Hong Kong waters have been showing an overall declining trend in dolphin numbers over much of the last decade (see Jefferson 2018), and the 3RS EIA predicted shifting of dolphins away to waters outside Hong Kong and a significant effect on numbers in Hong Kong during intensive periods of construction (EIA Report Section 13.9.2). There were seawall construction and marine filling in the 3RS works area, as well as reclamation works for the Tung Chung New Town Extension concurrently in North Lantau waters (note that the changes in the size of the different survey areas over the past few decades have been taken into account in the line transect analysis for this year, with the total area of the NWL area being reduced to account for this loss of potential habitat). Thus, year 2021 was still in the phase of construction that had the most impact on dolphins. Since the major reclamation work for the 3RS project has now concluded in 2021, some level of recovery would be expected, and some early signs of that might be seen. However, many more years of similar survey effort will be needed to examine this issue carefully, and we should not yet conclude that recovery has begun. In fact, some time delay in seeing an increase in dolphin numbers would be reasonable to expect.
Within NWL waters, dolphins have recently been mostly found around the Castle Peak and Lung Kwu Chau areas. In 2021 at least 16 dolphin sightings were made (in favourable weather conditions) in NWL, indicating that, while dolphins largely moved away from this area in 2020, they may be starting to return. The seasonal analysis showed that during summer and autumn, dolphin numbers are still reasonably higher in Hong Kong waters. The 2021 seasonal range is 31 to 43 dolphins. The spring estimate was the lowest (31 dolphins), while the autumn estimate was the highest (43 dolphins), and this indicates that, despite the overall reduction in the average number of dolphins using Hong Kong waters in recent years, there are well over 40 dolphins still present in Hong Kong in the summer/autumn months. The main concern is that dolphin numbers in NWL have decreased quite significantly in the recent couple of years. Some good news is that in WL and SWL dolphin numbers have remained similar to those in previous years. Past decreases suggested that construction activities in other areas of western Hong Kong waters (which, besides the 3RS works, includes IWMF works at Shek Kwu Chau) and other factors that are affecting dolphins north of Lantau Island may also be affecting their use of the waters south and west of Lantau Island. The potential for cumulative and far-ranging impacts from projects in specific areas is not well understood, and should be investigated in future monitoring efforts (including both those in relation to this project, and other studies outside the 3RS monitoring effort). This would be a particularly acute concern for the West Lantau area, which is known to represent the highest-density area for CWDs and although not directly impacted by marine construction in the past few years, the area has nonetheless shown evidence of a decrease in CWD numbers.
In earlier years, concerns had been expressed by some interested stakeholders that dolphin numbers in NWL may have decreased specifically due to hypothesized negative impacts from the re-routing of high-speed ferries (HSFs) to the Speed Control Zone (SCZ) north of Lung Kwu Chau. The analysis covering the entire first year post-SCZ (2016) provided an estimated abundance of 15 dolphins for NWL (refer to the 2016 annual report). The estimate for 2017 for the same area was 14 dolphins. The 2018 estimate was substantially higher at 22 dolphins. Therefore, the drop in 2019 to 8 dolphins was not likely due to the effects of the SCZ, which has been in operation for several years, but was more likely due to relatively more construction works for the 3RS and concurrent activities (such as changes in overall vessel traffic) in NL waters, or due to other unknown reasons. This belief is further bolstered by the fact that daily HSF trips were down substantially to single-digits in 2020 due to COVID-19 impacts, and yet CWD numbers continued to decrease. Whatever the reasons for the fluctuations in numbers of dolphins in the NWL area, there is still no evidence that the SCZ has had any negative impacts on the dolphins. Long-term CWD monitoring data that are being collected during the course of this project will help to identify any specific impacts resulting from overall changes in vessel traffic.
In terms of the concerns expressed in the 3RS EIA about the potential impacts on the travel corridor/area between both the project and SCLKCMP, and between CWD hotspots in NWL, NEL and WL, and the concern on the effectiveness of implementing the SkyPier HSF route diversion in alleviating the impacts on CWD travelling areas, the increased CWD sightings from vessel surveys in NEL area during 2018 indicated that a slight rebound in the use of these travel areas by CWDs had likely occurred, however this increase has not continued in 2019-2021. HZMB impacts were likely most severe during the period from 2013 to 2016 when construction works were ongoing (a period which saw an overall decline in CWD numbers in Hong Kong – Jefferson 2018), and the increase in CWD numbers seen in 2018 may have been the initial stages of recovery from that period of more intensive HZMB construction impacts. It is likely that the 3RS construction works and other concurrent activities in NL waters in 2019 onwards may have caused dolphins to again move away from these areas, as predicted in the EIA (Section 13.9.2). Nevertheless, it is noted that history suggests that when construction is completed, a rebound in numbers can again be expected (Jefferson 2018). Data since 2018 indicate that the travelling areas are still being used, although at a lower level. It should also be kept in mind that dolphins tend to move through these areas relatively quickly and do not generally spend as much time milling as they do in the main foraging/socialising areas, which may further reduce the chance of dolphin sightings. Indeed, there were high-speed boats frequently travelling around south of Sha Chau and waters of western part of the NWL survey area, as observed from surveys, that might be related to marine smuggling activities reported in the news (see Annex 1 of Appendix F). Such activities may also be a factor that inhibited CWD use in this travelling area.
Regarding the results of photo-identification work, a total number of 112 CWD individuals were identified altogether 327 times from all sightings in 2021, with 68 individuals (around 60.7%) sighted more than once. Forty-five individuals (around 66.2%) of the 68 re-sighted animals showed cross-area movement between different survey areas, with five animals recorded occurring in all three main survey areas (WL, SWL and NWL) in 2021. A remarkable increase is noted for cross-area movement involving NWL (21 individuals) compared to 2020 (only eight individuals). Regarding the re-sighted CWDs, the mother-and-mottled pair NLMM006 and NLMM013 was not observed in 2020, though the mother was seen without the presumed offspring. SLMM037, which has been frequently observed for several years, was the most commonly sighted individual in 2021 being frequent in WL and SWL waters. Eight identified dolphins were considered as year-round residents in view of their occurrence pattern in all seasons for consecutive years.
2.5.3.2
Land-based Theodolite Tracking
During 12 days and 72 hours of theodolite surveys at the station on LKC in 2021, a total of 16 CWD groups were tracked, and only 8 groups fit criteria for movement pattern summary due to most tracks being less than 10 minutes in duration. Due to low sample sizes, as in 2020, we were unable to conduct robust statistical analyses. While there are not enough data for robust statistical analyses of behaviours of CWD relative to group sizes, presence of vessels, etc., it is clear that habitat use off LKC has decreased in the past three years. We summarize the present data to show the apparent present situation and potential trends. During 12 days and 72 hours of theodolite surveys off SC in 2021, no dolphins were observed or tracked, similar to previous years (2018 to 2020).
The sighting rate off LKC in 2021 was 0.22 CWDs per survey hour, lower than sighting rates since 2017. This survey finding was in line with the vessel surveys over the past several years for this general area, which may be due to ongoing 3RS Project and other concurrent project construction activities in NL waters. However, there appears to be a slight increase in usage of this area in 2021, based on vessel survey data. The decline over the past several years may also have been due to other unknown factors, for example relating to the decline of fishing activity identified by monitoring teams here, or from other marine traffic activities not associated with 3RS construction works. In particular, decreased activity of pair and hang trawlers in Hong Kong since the trawl ban took effect may have resulted in decreased use of Hong Kong waters by CWDs, as a significant number of individual dolphins previously used to be attracted to fishing activities to assist in dolphin foraging (see Jefferson 2000; Chilvers et al. 2003).
In 2021, dolphins were sighted as far as 5.1 km from the LKC station. Survey data show that the heaviest use of waters north of the SCLKCMP by CWDs was in the late morning and early afternoon hours, with a peak in sightings during the 1400 hour block. CWDs were tracked primarily during the late autumn and early winter seasons and the dry season, but were not observed in March, May, June, July, August, or September (similar to 2020). Maximum CWD group size was 7 dolphins, more than the maximum numbers observed in 2020 and 2019.
Overall, waters off Lung Kwu Chau continue to be important habitat used for foraging and travelling. Socialising and resting were also observed in 2021, though less frequently than foraging and travelling. Only six vessels were recorded within 500m of CWD groups, which may be due to low sample size or reflect potential CWD avoidance of vessels off LKC. It is hoped that dolphins will return to this former CWD “hotspot” area north of the SCLKCMP as 3RS marine activities wind down in the next several years, and monitoring for rebound use in this important area will continue.
2.5.3.3
Passive Acoustic Monitoring
The PAM data continue to provide useful information on patterns of dolphin vocalization at night, which has previously been unavailable to us and could not be recorded during the land-based survey conducted during daytime at south of Sha Chau. The diurnal detection of clicks showed a consistent pattern of higher levels in late evening and at night compared with the day, which may be indicative of increased use of echolocation by dolphins during hours of darkness.
The PAM data provide evidence that dolphins are using the area around south of Sha Chau. In 2021, dolphins were present with especially high incidence in late autumn (November), and less so in other seasons, with no acoustic detections from January to July. This lack of detections may represent a reduction or absence of dolphin usage, but it could also be related to high ambient noise levels that reduced the detectability of dolphin signals. There were indeed high-speed boats frequently travelling around south of Sha Chau as observed from vessel surveys which probably inhibited CWD occurrence around the PAM location.
Dolphins were detected more frequently during night-time hours than during the day, and this may be related to nocturnal foraging behaviour. This has been a general trend throughout PAM monitoring in most parts of Hong Kong (Munger et al. 2016). It is also possible that at least a portion of this diel trend is related to dolphins utilizing this area more intensively at night than in daytime, because of decreased industrial activity at night.
The PAM in 2021 represents a decline in overall dolphin detection since the previous year in terms of percentage of days with dolphin detections, which is also reflected by land-based observations that indicate a potential decrease in dolphin habitat use. However, the seasonal and diel detection patterns observed in 2021 suggest that dolphins continue to use the area especially in autumn, and then primarily at night and in conditions when visual observation is not feasible.
2.5.4 Conclusions of CWD
Monitoring Results
With reference to the aims of construction phase CWD monitoring described in the EM&A Manual (Section 10.2.1.2-4), the key findings of CWD monitoring in 2021 are summarised as follows.
2.5.4.1 Effects on the Potential Shift in CWD Travelling
Areas and Habitat Use
The latest monitoring data indicate mixed trends in use of areas within Hong Kong waters in 2021, as compared to the previous year. The main area of increased use was Northwest Lantau, which showed a substantial increase from the previous year. As expected and predicted in the 3RS EIA, dolphins likely shifted their activities away from the 3RS construction activities as well as increasing marine works for the Tung Chung New Town Extension project in 2019 and 2020. Nevertheless, they still used Hong Kong’s western waters (primarily SWL and WL) for important ecological activities like foraging and resting, despite the disturbance. Whether the increase observed in 2021 is indicative of the start of a long-term dolphin recovery in the area remains to be seen. The main issue now is how much recovery there will be when the marine construction activities end in this area, and future monitoring efforts beyond the construction phase will help to address this.
2.5.4.2 Effectiveness of the HSF Speed and Routing
Restrictions to the CWDs
As detailed above, we now have six years of data from the period since the SCZ was implemented, and the information available from both the vessel-based and land-based monitoring indicates that dolphin use of the NWL area has fluctuated from year to year (ranging from 1 to 22 dolphins), with a period of initial increase after the SCZ was put into effect. Due to COVID-19 effects, 2020 was a year of significantly decreased HSF activity in general, including in the SCZ area, and yet there was still a reduction in the use of NWL. Therefore, the evidence suggests that the SCZ is not impacting dolphin use of this area, and at the same time, is likely reducing the chances of dolphins being hit by vessels travelling at high speed. Observations in 2021 are line with those previous assessments.
Waters around Lung Kwu Chau have historically been a significant year-round habitat, especially for foraging, though 2020 saw a very large decline in use of this area by CWDs. There is no evidence that the observed decline in dolphin use of the HSF SCZ around Lung Kwu Chau was due to ferries being re-routed to that area with slower speeds at the end of 2015. The recent (2019-2020) decline in numbers of dolphins in NWL area is not considered to be linked to HSF re-routings and the SCZ, and the apparent increase in 2021 is considered encouraging.
2.5.4.3 Trends in Long Term Monitoring Data
From vessel surveys conducted in 2020, CWD use of Hong Kong waters was down significantly from 2019, though there appears to be an uptick in 2021. West Lantau waters are still being used as the most important habitat in Hong Kong, as has been the case since CWD monitoring in Hong Kong first started in 1995/1996. It is estimated that 34 dolphins (on average) were found within Hong Kong waters in 2021, which is up from 32 dolphins last year (2020). Seasonally, the CWD number within Hong Kong ranged from about 31 to 43 in 2021. There continues to be no evidence that the implementation of the SkyPier SCZ is having any negative impacts on dolphin use of the NWL area. In fact, daily SkyPier HSF trips were down substantially in 2020 and 2021 due to COVID-19 (refer to Section 2.9 and Table 2.26), thus there was no substantive new data on CWDs tracked near HSFs over the monitoring period. Diverted SkyPier HSFs with speed control measures in place appear to be reducing risks to CWDs using the narrowing waters between south of SCLKCMP and the airport north, and at the same time do not appear to be resulting in apparent negative impacts on CWDs along the diverted route.
While land-based observations and theodolite tracking do not present overall estimates of numbers of dolphins, the 2021 data from LKC are similar to 2020 data, which shows a reduction in CWD groups sighted and tracked compared to earlier years of 2017-2019. This indicates a lower use of this area by CWDs, perhaps indicative of the increasing construction and other marine traffic activities in the NL waters, as discussed earlier. It is possible, as mentioned in Section 2.5.3, that the data from the three years before 2020 represent a partial rebound of dolphin use of waters north of Lantau Island due to cessation of the intensive HZMB construction activities of 2013-2016 (see also Jefferson 2018). In 2020, continuing from 2019, the ongoing 3RS Project marine construction activities reduced dolphin use in North Lantau waters in the way that was predicted in the 3RS EIA (Section 13.9.2). In 2021, some evidence of the start of a recovery was seen, but further data are needed to see if this will be sustained.
It is important to remember that dolphins shift around within their habitat from year to year, due to both natural and anthropogenic factors. Thus, evidence of a decrease or increase in numbers from one year to the next should not necessarily be taken as indication of an overall population decline or recovery. Dolphins live for many decades and thus long-term monitoring using consistent methods is needed over an extended period of time in order to evaluate the true conservation status of the CWD population and how its use of Hong Kong waters is being affected.
The CWD construction phase monitoring data so far appear to be generally consistent with findings of the ecological assessments completed during the 3RS EIA, which predicted significant negative impacts during construction, including from the physical loss of habitat due to the reclamation (EIA Report Section 13.9.1). No unexpected ecological impacts on CWDs have been identified, while the increase in abundance in 2021, though small, is encouraging nonetheless. However, it should be noted that dolphins shifting away from NL and nearby waters is to be expected during 3RS construction works, such as increasingly intensive seawall construction and marine filling activities, as had occurred in 2020 (and early 2021), and this is broadly in line with EIA predictions.
In the 3RS EIA and as reported in the last several Annual EM&A Reports, it was predicted that dolphins would shift away from portions of their home range that are experiencing intense human activities and that appears to have been the case in 2020 as seawall works and marine filling activities intensified. These impacts are anthropogenic disturbances and therefore are of conservation concern; however, they are likely temporary and reversible and previous studies have supported that dolphin numbers can be expected to recover over the long-term, after completion of works (assuming that the habitat is properly protected and still of adequate quality). Monitoring for the 3RS will continue during 2022 and beyond, with the goal being to determine the extent of remaining project impacts, to facilitate a review of the effectiveness of proposed mitigation measures and to determine any need for adaptive management measures.
Monitoring of dolphins must continue in order to allow us to evaluate the full extent of impacts and any recovery that occurs in the future, and stabilization or an increase in abundance of Hong Kong CWDs is desirable for the long-term health of this population. As dolphin numbers in Hong Kong appeared to be going down in 2020, and remained much lower than in the past in 2021, though with a slight increase compared with 2020, diligent monitoring should continue. At this stage of 3RS construction, all recommended mitigations have been implemented and although impacts are occurring, these are likely to be temporary and within previously predicted patterns. Once marine construction is completed, and the proposed marine park in North Lantau comes into effect, the situation should improve. The effectiveness of the mitigation measures will be kept under review over the next few years as CWD monitoring continues.
2.5.4.4 Long Term Conservation and Management Suggestions
In terms of the long-term conservation and management of the CWD population and specifically that portion that uses Hong Kong waters, it is important for numbers to stabilise once marine construction is completed, as the evidence suggests both that dolphins are using Hong Kong waters less intensively and that the overall population is declining (see Huang et al. 2012; Jefferson 2018). The intensive evaluation of construction methods that was undertaken in the EIA process for this project (which resulted in methods that are less harmful to dolphins, such the use of Deep Cement Mixing for site stabilization) should be seen an example and emulated in future impact assessments. Importantly, there is also ongoing evaluation of the impacts, and the ability to re-evaluate, if significant, unexpected impacts appear to be occurring.
A major goal for Hong Kong and mainland management authorities (primarily the Agriculture, Fisheries and Conservation Department) should be to establish effective measures including, but not limited to, protection of critical foraging and breeding habitat, as well as important travel routes for the dolphins. Most importantly, the area along the entire west coast of Lantau Island has consistently been used as prime habitat by CWDs for the past several decades, but unfortunately numbers there have declined recently. This region has been confirmed by the current 3RS Project monitoring effort to remain as the most important habitat for dolphins in Hong Kong, based on densities of CWD use, but most of the area remains unprotected. The formation of Marine Parks/ Reserves for CWDs in this area should be seen as a high priority for protecting critical dolphin habitat for the future of CWDs in Hong Kong. If it is used properly, the knowledge learned from the 3RS project, as well as the funding support and attention given the CWDs from this project (e.g., through the Marine Ecology Enhancement Fund), can be very helpful for management authorities in achieving the important long-term goal of stabilizing the CWD population, and ensuring its long-term health and survival.
2.5.5 Site Audit for CWD-related
Mitigation Measures
During the reporting period, silt curtains were in place by the contractors for marine filling and bored piling works, and dolphin observers were deployed by contractors in accordance with the Marine Mammal Watching Plan. Teams of at least two dolphin observers were deployed by contractors for continuous monitoring of the Dolphin Exclusion Zone (DEZ) for DCM works, seawall construction and marine bored piling for approach lights in accordance with the DEZ Plan. Training for the dolphin observers on the implementation of MMWP and DEZ monitoring was provided by the ET prior to the aforementioned works, with the training records kept by the ET. From the contractors’ MMWP observation records, no dolphins or other marine mammals were observed within or around the silt curtains during the reporting period. As for DEZ monitoring records, no dolphins or other marine mammals were observed within the DEZs in this reporting period. These contractors’ records were audited by the ET during site inspection.
Audits of acoustic decoupling for construction vessels were carried out during weekly site inspection and are summarised in Section 2.7. Summary of audits of SkyPier High Speed Ferries route diversion and speed control and construction vessel management are presented in Section 2.8 and Section 2.9 respectively.
2.6
Sewage
Flow Monitoring
In accordance with the approved EIA Report (AEIAR-185/2014) for Expansion of Hong Kong International Airport into a Three-Runway System (3RS), the gravity sewer from the airport discharge manhole to TCSPS was recommended to be upgraded by AAHK to cater for the ultimate design sewage flow from the expanded airport. It was recommended in section 6.2.1.1 of the Manual that AAHK should conduct annual monitoring for the sewage flow build-up of the gravity sewer from the airport discharge manhole to TCSPS one year before the scheduled commencement of operation of the proposed third runway. The annual monitoring results shall inform the timing of commencement of the planning of the sewer upgrading works. The sewage flow monitoring methodology paper (the Paper) was prepared, submitted and subsequently approved by EPD on 21 June 2021.
2.6.1
Brief
Summary of the Agreed Method
With reference to the Paper, the existing sewer to be monitored is the section between FMH7042035 (reference point A) and FMH7043286 (reference point C). A schematic diagram of the sewage system between reference point A and C is presented in Figure 2.8. The locations of these reference points are presented in Figure 2.9. To determine if the threshold of 80% of the design capacity is being reached, an approach using the Colebrook-White equation was used.
● Segment 1: for sewage pipelines serving the airport – the critical segment is the 1050mm sewer between manholes FMH7042032 and FMH7042033, where the 80% threshold of full flow capacity is 53,395.2 m3/day; and
● Segment 2: for the sewage pipelines serving the airport and catchment L4 – the critical segment is the 1050mm sewer between manholes FMH7043288 and FMH7043287, where the of 80% threshold of full flow capacity is 57,628.8 m3/day.
According to the Paper, segment 1 would reach its 80% full flow capacity before segment 2. Hence, segment 1 was considered the critical segment within the section between reference points A and C, and it was agreed to conduct sewage flow monitoring for segment 1 only. With the daily flow rate of SPS-1, which collects sewage arising from the Airport, is available from AAHK, desk-based flow monitoring would be conducted by comparing the daily average flow rate of SPS-1 (i.e. Q1) against the threshold of 80% of pipe capacity of segment 1 (i.e. 53,395.2 m3/day) in accordance with the following criteria:
● If Q1 ≤ 53,395.2 m3/day, planning of sewerage upgrading works can be on hold until results of next annual monitoring; and
● If Q1 > 53,395.2 m3/day, planning of sewerage upgrading works shall be considered to start and annual monitoring shall be discontinued.
Within the monitoring period, if the daily average flow rate of SPS-1 (i.e. Q1) is higher than the threshold of 53,395.2 m3/day, planning of sewerage upgrading works shall be considered to start and the annual monitoring shall be discontinued. The above approach was agreed to be adopted as part of annual monitoring for the sewage flow increment of the concerned gravity sewer in 2021 and 2022.
2.6.2
Desk-Based
Monitoring Result
To fulfil the requirements as mentioned in previous section, the annual sewage flow monitoring has been started since June 2021. According to the daily flow monitoring record of SPS-1 from June to December 2021 (see Appendix D), the daily average flows were well below the above-mentioned threshold of 53,395.2 m3/day. To conclude, the summary of daily average flow at SPS1 during this reporting period is presented in Table 2.18. For the subsequent sets of sewage flow monitoring data for SPS-1, it will be presented in upcoming Quarterly and Annual EM&A Reports.
Table 2.18: Summary of daily average flow at Sewage Pumping Station 1 (SPS1)
|
Month |
Jun-21 |
Jul-21 |
Aug-21 |
Sep-21 |
Oct-21 |
Nov-21 |
Dec-21 |
|
Average of daily flow at SPS1 (in m3/day) |
13,460 |
13,989 |
14,335 |
13,448 |
16,319 |
15,717 |
14,866 |
Source: Excerpted from Quarterly EM&A Reports
2.7
Landscape and
Visual Mitigation Measures
Implementation of applicable landscape and visual mitigation measures (reference to the environmental protection measures CM1 – CM10 in Appendix C) was monitored in accordance with the Manual. All measures undertaken by both the contractor and the landscape contractor during the construction phase and first year of the operation phase are audited by a landscape architect, as a member of the ET, on a regular basis to ensure compliance with the intended aims of the measures.
Site inspection and audit are undertaken as necessary in the construction and operation phase in accordance with the Monitoring Programme for Landscape and Visual as shown in Table 2.19. In case of non-conformity, specific recommendations will be made and actions will be proposed in accordance with the Event and Action Plan as shown in Table 2.20. No non-conformity was recorded during the reporting period.
Table 2.19: Monitoring Programme for Landscape and Visual
|
Stage |
Monitoring Task |
Monitoring Report |
Form of Approval |
Frequency |
|
Detailed Design |
Checking of design works against the recommendations of the landscape and visual impact assessments within the EIA shall be undertaken during detailed design and tender stage, to ensure that they fulfil the intention of the mitigation measures. Any changes to the design, including design changes on site shall also be checked. |
Report by AAHK / PM confirming that the design conforms to requirements of EP. |
Approved by Client |
At the end of the Detailed Design Phase |
|
Construction |
Checking of the contractor’s operations during the construction period. |
Report on Contractor's compliance, by ET |
Counter signature of report by IEC |
Weekly |
|
Establishment Works |
Checking of the planting works during the twelve-month Establishment Period after completion of each batch of transplanting works. |
Report on Contractor's compliance, by ET |
Counter signature of report by IEC |
Every two months |
|
Long Term Management (10 year) |
Monitoring of the long-term management of the planting works in the period up to 10 years after completion of each batch of transplanting works. |
Report on Compliance by ET or Maintenance Agency as appropriate |
Counter signature of report by Management Agency |
Annually |
Table 2.20: Event and Action Plan for Landscape and Visual
|
Event Action Level |
Action |
|||
|
|
ET |
IEC |
AAHK / PM |
Contractor |
|
Design Check |
Check final design conforms to the requirements of EP and prepare report. |
Check report. Recommend remedial design if necessary. |
Undertake remedial design if necessary. |
|
|
Non-conformity on one occasion |
Identify source. Inform IEC and AAHK / PM. Discuss remedial actions with IEC, AAHK / PM and Contractor. Monitor remedial actions until rectification has been completed. |
Check report. Check Contractor’s working method. Discuss with ET and Contractor on possible remedial measures. Advise AAHK / PM on effectiveness of proposed remedial measures. Check implementation of remedial measures. |
Notify Contractor. Ensure remedial measures are properly implemented. |
Amend working methods to prevent recurrence of non-conformity. Rectify damage and undertake additional action necessary. |
|
Repeated Non-conformity |
Identify source. Inform IEC and AAHK / PM. Increase monitoring frequency. Discuss remedial actions with IEC, AAHK / PM and Contractor. Monitor remedial actions until rectification has been completed. If non-conformity stops, cease additional monitoring. |
Check monitoring report. Check Contractor’s working method. Discuss with ET and Contractor on possible remedial measures. Advise AAHK / PM on effectiveness of proposed remedial measures. Supervise implementation of remedial measures. |
Notify Contractor. Ensure remedial measures area properly implemented. |
Amend working methods to prevent recurrence of non-conformity. Rectify damage and undertake additional action necessary. |
2.7.1 The implementation status of the environmental
protection measures
The implementation status of the environmental protection measures is summarised below in Table 2.21. For trees which were managed by the Project during the reporting period, relevant measures have been implemented by Contracts 3302, 3503, 3508, 3602 and 3801. Contract 3802 would begin to undertake tree management measures subject to the handover of site area. Those trees which were within the Project boundary yet to be taken care by existing 3RS Contractors during the reporting period were managed by AAHK.
Table 2.21: Landscape and Visual – Construction Phase Audit Summary
|
Landscape and Visual Mitigation Measures during Construction Implementation Status |
Implementation Status |
Relevant Contract(s) in the Reporting Period |
|
CM1- The construction area and contractor’s temporary works areas shall be minimised to avoid impacts on adjacent landscape. |
The implementation of mitigation measures were checked by ET during weekly site inspection and clarified by the Contractors during the monthly Environmental Management Meetings. Implementation of the measures CM5, CM6 and CM7 by Contractors was observed. |
3RS Project contracts |
|
CM2 – Reduction of construction period to practical minimum. |
||
|
CM3 – Phasing of the construction stage to reduce visual impacts during the construction phase. |
||
|
CM4 – Construction traffic (land and sea) including construction plants, construction vessels and barges shall be kept to a practical minimum. |
||
|
CM5 – Erection of decorative mesh screens or construction hoardings around works areas in visually unobtrusive colours. |
||
|
CM6 – Avoidance of excessive height and bulk of site buildings and structures |
||
|
CM7 – Control of night-time lighting by hooding all lights and through minimisation of night working periods |
||
|
CM8 – All existing trees shall be carefully protected during construction. Detailed Tree Protection Specification shall be provided in the Contract Specification. Under this specification, the Contractor shall be required to submit, for approval, a detailed working method statement for the protection of trees prior to undertaking any works adjacent to all retained trees, including trees in contractor’s works areas |
Tree Protection Specifications have been provided in the relevant Contract Specifications respectively for implementation by the Contractors under the Project.
The Contractors’ performance on the implementation of the trees maintenance and protection measures were observed and checked by the ET weekly during construction period. |
3302, 3503, 3508, 3602, 3801
3802 (To be implemented) |
|
CM9 – Trees unavoidably affected by the works shall be transplanted where practical. A detailed Tree Transplanting Specification shall be provided in the Contract Specification, if applicable. Sufficient time for necessary tree root and crown preparation periods shall be allowed in the project programme |
Tree Transplanting Specifications have been provided in the relevant Contract Specifications respectively for implementation by the Contractors under the Project where trees will unavoidably be affected by the construction works.
The Contractors were required to submit Method Statements for tree transplanting prior to the transplanting works. Tree inspections were conducted by ET to check the tree transplanting works implemented by the Contractors on site.
The Contractors’ performance on the implementation of trees maintenance and protection measures on transplanted trees were observed and checked by the ET bi-monthly during the 12-month establishment period after the completion of each batch of transplanting works.
Long term management of the transplanted trees were currently monitored by ET annually. |
3503, 3508, 3801
3802 (To be implemented) |
|
CM 10 – Land formation works shall be followed with advanced hydroseeding around taxiways and runways as soon as practical |
To be implemented around taxiways and runways as soon as practicable. |
To be implemented |
The 3RS Project is a mega project covering a number of detailed design contracts and many construction works contracts in different design and construction stages. Works areas would be taken up by different 3RS works contracts in stages with the commencement of construction, and the landscape and visual elements of these contract of the 3RS Project also designed and implemented at various stages of the Project.
Broad-brush tree survey and assessment were undertaken for the entire 3RS Project during EIA stage. After that, detailed design consultants had conducted more detailed tree surveys and assessments so that the landscape and visual elements were refined and aligned with their respective design areas. With the award of specific 3RS construction works contracts, the respective contractors would conduct their own detailed tree survey and assessment as necessary, to confirm the tree status at the time of their possession of the site. The tree survey and assessment from the respective contractors were taken as the baseline of that particular piece of works area before being affected by 3RS Project. Some of the tree group areas as identified in approved EIA report were affected by 3RS construction works as of 2021. Environmental monitoring and audit work which included the auditing of contractor’s work in landscape and visual aspects such as tree preservation, protection and transplantation was implemented in accordance with the updated construction programme and the relevant requirements of the EP and the Updated EM&A Manual.
The total number of retained trees, transplanted trees and to-be-transplanted trees under the management of Project are summarized in Table 2.22. The tree schedule updated as of end 2021 is shown in Appendix H.
Table 2.22: Summary of the Number of Retained, Transplanted and To-be-transplanted Trees as of December 2021
|
Existing |
|
|
|
||
|
Contract |
Retain (nos.) |
Transplanted (nos.) |
To-be-transplanted (nos.) |
||
|
Establishment Period |
Long Term Management Period |
||||
|
3302 |
9 |
0 |
0 |
0 |
|
|
3503 |
0 |
6 |
3 |
0 |
|
|
3508(1) |
24 |
12 |
0 |
0 |
|
|
3602 |
2 |
0 |
0 |
0 |
|
|
3801 |
17 |
0 |
5(2) |
0 |
|
|
Sub-total |
52 |
18 |
8 |
0 |
|
|
Provisional |
|
|
|
||
|
Contract |
Retain (nos.) |
Transplanted (nos.) |
To-be-transplanted (nos.) |
||
|
3508(1) |
51 |
0 |
10 |
||
|
Sub-total |
51 |
0 |
10 |
||
|
Grand Total |
103 |
26 |
10 |
||
Note:
(1) As some of the site areas have been handed over to Contract 3508, Contractor of Contract 3508 is currently managing the trees that are located within their site area. Existing trees to be managed by Contract 3508 is subject to change after initial tree surveys for each batch of site areas have been conducted by the Contractor.
(2) Three transplanted trees (CT1194, CT1794 and CT1795) were subsequently felled after transplantation. Please refer to Table 2.24 for details.
Table 2.23 lists the affected tree ID together with the reasons for change of tree status between the tree schedules as of end 2020 and end 2021.
The total number of retained trees of the Project as of end 2021 was 52. Compared to 118 nos. of retained trees for existing works contracts reported in the tree schedule as of end 2020, the change in number was due to the following reasons:
· A works area with 21 nos. of trees next to East Coast Road and Sky City Interchange were handed over to Contract 3508 and the status of those trees were confirmed to be retained (+21 nos.);
· ET and 3801 Contractor’s on-site inspections confirmed that the status of 1 no. of tree near the Airport North Interchange should be retained tree (+1 no.);
· A works area with 4 nos. of trees were handed over from Contract 3801 to Contract 3508 (no change in numbers);
· Initial tree survey from Contractor 3801 covered some areas which confirmed not to be works areas and therefore excluded from the Project area. Trees located in those areas were removed from the retained tree list under the Project (-41 nos.);
· 1 no. of tree near Airport North Interchange under Contract 3801 was removed due to safety concern of Airport Express Line (AEL) operation in May 2021 (-1 no);
· Contractor confirmed that 11 nos. of trees under Contract 3503 were not within their works area. Therefore, trees located in those areas were removed from the retained tree list under the Project in July 2021 (-11 nos.);
· Tree survey report 2021 from Contractor 3801 confirmed that 3 nos. of trees were included as additional trees in the works area under Contract 3801 (+ 3 nos.);
· 1 no. of tree was handed over from Contract 3801 to Contract 3802, and was subsequently removed by the Contractor due to conflict with 3RS works in September 2021 (-1 no.);
· 4 nos. of trees near Airport North Interchange under Contract 3508 were removed due to safety concern of AEL operation (-4 nos);
· A storage area with some trees were handed over from Contract 3801 to AAHK. The trees were excluded from the Project (-28 nos);
· Works areas with trees were handed over from Contract 3503 to Contract 3508, of which part of the trees were felled while part of the trees would be felled by Contract 3508 as planned (-5 nos);and
· A works area with 3 nos. of trees were handed over from Contract 3503 to Contract 3508 (no change in numbers).
Moreover, the status of some trees were further updated as of end 2021 due to the confirmation of tree felling information by contractors or AAHK in May 2022.
Table 2.23: Summary of the Tree Status Changes between end 2020 and end 2021
|
Tree ID(s) |
Contract
|
Status as of end 2020 |
Status as of end 2021 |
Remarks |
Impacts to Total Tree Number |
|
T1491, T1492, T1506, T1507, T1508, T1509, T1512, T1514, T1515, T1518, T1519, T1521, T1522, T1524, T1525, T1527, T1528, T1531, T1532, T1536, A2 |
3508 |
NA |
Retain |
Works area with 21 nos. of trees were handed over to Contract 3508 in Mar 2021 |
Retain: +21 nos. |
|
CT1379 |
3801 |
Fell |
Retain (as of Feb 2021);
|
The status of one tree was updated to retain during site inspection in Feb 2021. |
Retain: +1 nos. |
|
CT1373, CT1375, CT1376, CT1378, CT1379, CT1384, CT1387, CT1388, CT1389, CT1390, CT1391, CT1392, CT1393, CT1394, CT1395, CT1396, CT1397, CT1399, CT1403, CT1404, CT1443, CT1448, CT1449, CT1450, CT1451, |
3801 |
Retain |
Not within Project’s contract works area |
25 nos. of trees were confirmed not located within Project’s contract works area in May 2021.
|
Retain: - 41 nos. |
|
CT1426, CT1427, CT1428, CT1429, CT1432, CT1433 |
3801 |
Retain |
Not within Project’s contract works area (as of May 2021); To-be-felled |
6 nos. of trees were confirmed not located within Project’s contract works area in May 2021.
These 6 nos. of trees were further confirmed in May 2022 located within 3802 contract works area and status updated as to-be-felled for future demolition of SWPH-1 or site office compound set up. |
|
|
CT1515, CT1516, CT1517, CT1518, CT1519, CT1520, CT1521, CT1522, CT1523, CT1524 |
3801 |
Retain |
Not within Project’s contract works area (as of May 2021) Fell |
10 nos. of trees were confirmed not located within Project’s contract
works area in May 2021. These 10 nos. of trees were further confirmed in May 2022 located within 3802 contract works area and felled for site office compound set up. |
|
|
CT1417 |
3801 |
Retain |
Fell |
1 no. of tree was removed due to safety concern of Airport Express Line (AEL) operation in May 2021. |
Retain: - 1 no. |
|
T1252, T1253, T1254, T1255, T1256, T1257, T1258, T1259, T1260, T1278, T1280 |
3503 |
Retain |
Not within Project’s contract works area |
11 nos. of trees were confirmed not located within Project’s contract works area in Jul 2021. |
Retain: - 11 nos. |
|
T4, T5, T6 |
3801 |
N/A |
Retain |
3 nos. of trees were newly added in the works area of this contract in Aug 2021. |
Retain: + 3 nos. |
|
CT1888 |
3801 |
Retain |
Fell |
1 no. of tree was handed over from Contract 3801 to Contract 3802 and was subsequently felled in Sep 2021 due to conflict with 3RS works. |
Retain: - 1 no. |
|
T1462, T1463, T1464, T1467 |
3508 |
Retain |
Fell |
4 nos. of trees were removed due to safety concern of Airport Express Line (AEL) operation in Oct 2021. |
Retain: - 4 nos. |
|
CT1843, CT1844, CT1845, CT1846, CT1847, CT1848, CT1849, CT1850, CT1851, CT1852, CT1853, CT1859, CT1860, CT1861, CT1862, CT1865, CT1866, CT1867, CT1868, CT1869, CT1870, CT1871, CT1872, CT1873, CT1874, CT1876, CT1877, CT1878 |
AAHK |
Retain |
Excluded from the Project |
28 nos. of trees were handed over to AAHK. The trees were excluded from the Project.
|
Retain: - 28 nos. |
|
T3030, T3031 |
3508 |
Retain |
To-be felled |
2 nos. of trees were handed over from Contract 3503 to Contract 3508 and would be felled by Contract 3508 as planned. |
Retain: - 5 nos. |
|
T3189, T3191, T3194 |
3508 |
Retain |
Fell |
3 nos. of trees were handed over from Contract 3503 to Contract 3508 and confirmed they were felled by Contract 3508 in December 2022 |
Furthermore, the total number of provisional retain trees of Contract 3508 has been reduced to 51 as compared to the 155 trees in the previous reporting period. The change in number was because 25 nos. of trees were handed over from AAHK to the Contractor and counted as existing trees under the contract, and 79 nos. trees were confirmed not within their works area.
A total of twelve trees under Contract 3508 (i.e. T1493, T1494, T1495, T1496, T1497, T1498, T1499, T1500, T1501, T1502, T1503, T1504) were transplanted during the reporting period. Therefore, the cumulative total number of transplanted trees of the Project has been increased from 14 in the previous reporting period to 26. Meanwhile, a total of three trees under Contract 3503 (i.e. T835, T836, T838) were transitioned from establishment period to long term management period during the reporting period.
The summary of transplanted trees updated in the reporting period is shown in Table 2.24. Photos of the transplanted trees are presented in Table 2.25 and the locations of newly transplanted trees during the reporting period are presented in Figure 2.10.
Table 2.24: Summary of the Transplanted Trees in the Reporting Period
|
Tree ID |
Transplant Date |
Management Stage |
Management Agency |
Remarks |
|
CT276 |
3 May 2018 |
Establishment period 4 May 2018 – May 2019 |
Contract 3801 |
NA |
|
Long Term Management period Jun 2019 – May 2028 |
Southern Landside Petrol Filling Station |
|||
|
CT1253 |
4 May 2018 |
Establishment period 5 May 2018 – May 2019 |
Contract 3801 |
|
|
Long Term Management period Jun 2019 – May 2028 |
Southern Landside Petrol Filling Station |
|||
|
T835 |
22 Jan 2020 |
Establishment period 23 Jan 2020 – Jan 2021 |
Contract 3503 |
NA |
|
Long Term Management period Feb 2021 – Jan 2030 |
AAHK |
|||
|
T836 |
13 Dec 2019 |
Establishment period 14 Dec 2019 – Jan 2021 |
Contract 3503 |
NA
|
|
Long Term Management period Feb 2021 – Jan 2030 |
AAHK |
|||
|
T838 |
22 Jan 2020 |
Establishment period 23 Jan 2020 – Jan 2021 |
Contract 3503
|
NA
|
|
Long Term Management period Feb 2021 – Jan 2030 |
AAHK |
|||
|
T812 |
21 Dec 2020 |
Establishment period 22 Dec 2020 – Dec 2021 |
Contract 3503 |
NA |
|
T814 |
20 Dec 2020 |
Establishment period 21 Dec 2020 – Dec 2021 |
Contract 3503 |
NA |
|
T815 |
15 Dec 2020 |
Establishment period 16 Dec 2020 – Dec 2021 |
Contract 3503 |
NA |
|
T829 |
18 Dec 2020 |
Establishment period 19 Dec 2020 – Dec 2021 |
Contract 3503 |
NA |
|
T830 |
14 Dec 2020 |
Establishment period 15 Dec 2020 – Dec 2021 |
Contract 3503 |
NA |
|
T831 |
19 Dec 2020 |
Establishment period 20 Dec 2020 – Dec 2021 |
Contract 3503 |
NA |
|
CT1194 |
4 May 2018 |
Establishment period 5 May 2018 – May 2019 |
Contract 3801 |
NA |
|
Long Term Management period Jun 2019 – May 2028 |
Southern Landside Petrol Filling Station |
Uprooted and collapsed due to Typhoon Higos on 18 August 2020. Tree removal was conducted as recommended by tree specialist of the contractor of Southern Landside Petrol Filing Station. |
||
|
CT1794 |
3 May 2018 |
Establishment period 4 May 2018 – May 2019 |
Contract 3801 |
NA |
|
Long Term Management period Jun 2019 – May 2028 |
AsiaWorld-Expo |
The tree within the land parcel was acquired by the government for construction of emergency hospital to handle COVID19 pandemic at AsiaWorld-Expo. The tree was felled in late 2020. |
||
|
CT1795 |
3 May 2018 |
Establishment period 4 May 2018 – May 2019 |
Contract 3801 |
NA |
|
Long Term Management period Jun 2019 – May 2028 |
AsiaWorld-Expo |
The tree within the land parcel was acquired by the government for construction of emergency hospital to handle COVID19 pandemic at AsiaWorld-Expo. The tree was felled in late 2020. |
||
|
Newly Transplanted Trees during the Reporting Period |
||||
|
T1493 |
6 Jul 2021 |
Establishment period 7 Jul 2021 – Jul 2022 |
Contract 3508 |
Original Site: East Coast Road Recipient Location: East Coast Road |
|
T1494 |
6 Jul 2021 |
Establishment period 7 Jul 2021 – Jul 2022 |
Contract 3508 |
|
|
T1495 |
10 Jul 2021 |
Establishment period 11 Jul 2021 – Jul 2022 |
Contract 3508 |
|
|
T1496 |
5 Jul 2021 |
Establishment period 6 Jul 2021 – Jul 2022 |
Contract 3508 |
|
|
T1497 |
5 Jul 2021 |
Establishment period 6 Jul 2021 – Jul 2022 |
Contract 3508 |
|
|
T1498 |
29 Jun 2021 |
Establishment period 30 Jun 2021 – Jul 2022 |
Contract 3508 |
|
|
T1499 |
29 Jun 2021 |
Establishment period 30 Jun 2021 – Jul 2022 |
Contract 3508 |
|
|
T1500 |
30 Jun 2021 |
Establishment period 1 Jul 2021 – Jul 2022 |
Contract 3508 |
|
|
T1501 |
30 Jun 2021 |
Establishment period 1 Jul 2021 – Jul 2022 |
Contract 3508 |
|
|
T1502 |
5 Jul 2021 |
Establishment period 6 Jul 2021 – Jul 2022 |
Contract 3508 |
|
|
T1503 |
6 Jul 2021 |
Establishment period 7 Jul 2021 – Jul 2022 |
Contract 3508 |
|
|
T1504 |
24 Jun 2021 |
Establishment period 25 Jun 2021 – Jul 2022 |
Contract 3508 |
|
Table 2.25: Photos of the Existing Transplanted Trees in the Reporting Period
|
Under 12-month Establishment Period: |
||
|
|
|
|
|
T812 |
T814 |
T815 |
|
|
|
|
|
T829 |
T830 |
T831 |
|
Newly Transplanted Trees during the Reporting Period |
||
|
|
|
|
|
T1493 |
T1494 |
T1495 |
|
|
|
|
|
T1496 |
T1497 |
T1498 |
|
|
|
|
|
T1499 |
T1500 |
T1501 |
|
|
|
|
|
T1502 |
T1503 |
T1504 |
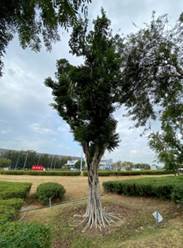
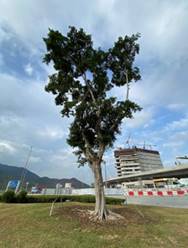
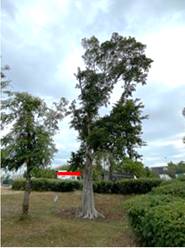
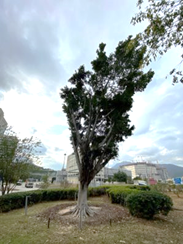
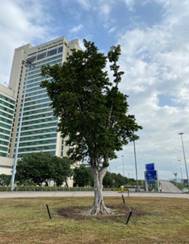
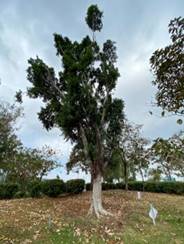
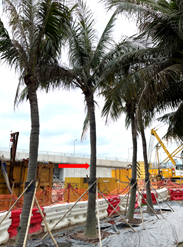
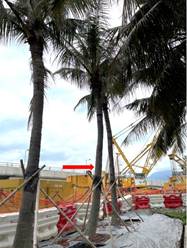
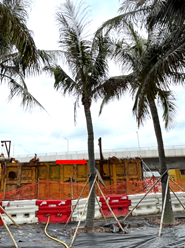
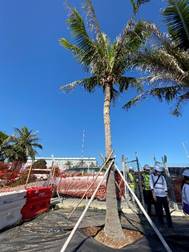
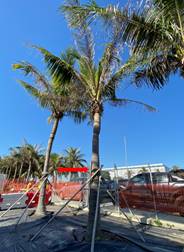
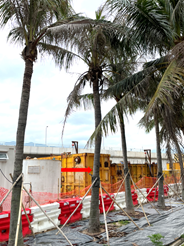
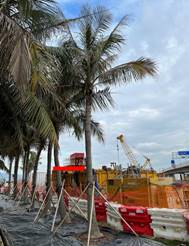
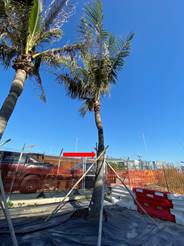
|
Under 10-year Long-term Management (Feb 2021 to Jan 2030): |
||
|
|
|
|
|
T835 |
T836 |
T838 |
|
Under 10-year Long-term Management (Jun 2019 to May 2028): |
||
|
|
|
|
|
T276 |
T1253 |
|
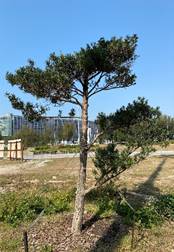
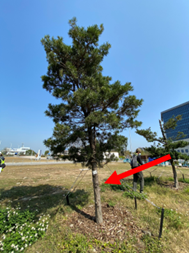
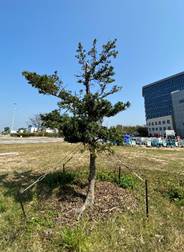
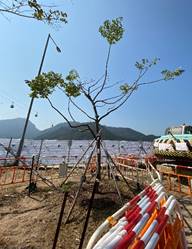
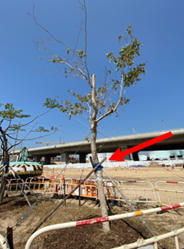
2.8
Environmental
Site Inspection
Site inspections of the construction works were carried out on a weekly basis to monitor the implementation of proper environmental pollution control and mitigation measures for the Project. Bi-weekly site inspections were also conducted by the IEC. Besides, ad-hoc site inspections were conducted by ET and IEC if environmental problems were identified, or subsequent to receipt of an environmental complaint, or as part of the investigation work. These site inspections provided a direct means to reinforce the specified environmental protection requirements and pollution control measures in construction sites.
During site inspections, environmental situation, status of implementation of pollution control and mitigation measures were observed both within the site area as well as outside the project sites which was likely to be affected, directly or indirectly, by the site activities. Environmental documents and site records, including waste disposal record, maintenance record of environmental equipment, and relevant environmental permit and licences, were also checked on site. Observations were recorded in the site inspection checklist and passed to the contractor together with the appropriate recommended mitigation measures where necessary in order to advise contractors on environmental improvement, awareness and on-site enhancement measures. The observations were made with reference to the following information during the site inspections:
· The EIA and EM&A requirements;
· Relevant environmental protection laws, guidelines, and practice notes;
· The EP conditions and other submissions under the EP;
· Monitoring results of EM&A programme;
· Works progress and programme;
· Proposal of individual works;
· Contract specifications on environmental protection; and
· Previous site inspection results.
Good site practices were observed in site inspections during the reporting period. Advice was given when necessary to ensure the construction workforce were familiar with relevant procedures, and to maintain good environmental performance on site. Regular toolbox talks on environmental issues were organized for the construction workforce by the contractors to ensure understanding and proper implementation of environmental protection and pollution control mitigation measures. Environmental briefings on EP and EM&A requirements were also provided to the new contracts by ET.
Summary of implementation status of the environmental mitigation measures for the construction phase of the Project during the reporting period is provided in Appendix C.
2.9
Audit of the SkyPier High Speed Ferries
The Marine Travel Routes and Management Plan for High Speed Ferries of SkyPier (the SkyPier Plan) was submitted to the Advisory Council on the Environment (ACE) for comment and subsequently submitted to and approved by EPD in November 2015 under EP Condition 2.10. The approved SkyPier Plan is available on the dedicated website of the Project. In the SkyPier Plan, AAHK has committed to implementing the mitigation measure of requiring HSFs of SkyPier travelling between HKIA and Zhuhai / Macau to start diverting the route with associated speed control across the area, i.e. SCZ, with high CWD abundance. The route diversion and speed restriction at the SCZ have been implemented since 28 December 2015. The IEC has also performed audit on the compliance of the requirements as part of the EM&A programme. The latest summary of key audit findings in the reporting period is presented in Table 2.26.
According to the approved SkyPier Plan, dolphin habitat index has been reviewed in the reporting period based on findings of the AFCD’s marine mammals monitoring report 2020-21 and historical dolphin density records. Grids for dolphin hotspot remained largely unchanged, thus the HSF route diversion arrangement remained unchanged.
Due to the COVID-19 pandemic, all SkyPier HSF services to/from Zhuhai and Macau have been suspended from 25 March 2020 until further notice. Limited HSF services from other destination, which does not require the use of the diverted route, were provided starting from 28 October 2020.
No HSF movement between HKIA SkyPier to/from Zhuhai and Macau was recorded in the reporting period. The daily movements of all SkyPier HSFs in the reporting period, including those not using the diverted route, ranged between 1 and 11, which falls within the maximum daily cap number of 125. The annual daily average of all SkyPier HSF movements in the reporting period was 3.7, which falls within the annual daily average cap of 99 SkyPier HSF movements.
The construction works of the Hong Kong Offshore LNG Terminal Project were carried out from Q3 to Q4 2021. However, there was no implication to the route diversion operation of the SkyPier HSFs since all SkyPier HSF services to /from Zhuhai and Macau were suspended. ET will continue to closely monitor the implementation of the SkyPier Plan.
Table 2.26: Summary of Key Audit Findings against the SkyPier Plan
|
Requirements in the SkyPier Plan |
Jan-21 |
Feb-21 |
Mar-21 |
Apr-21 |
May-21 |
Jun-21 |
Jul-21 |
Aug-21 |
Sep-21 |
Oct-21 |
Nov-21 |
Dec-21 |
|
Total number of HSF movements recorded and audited for HSF to/from Zhuhai and Macau |
0 |
0 |
0 |
0 |
0 |
0 |
0 |
0 |
0 |
0 |
0 |
0 |
|
Use diverted route and enter / leave SCZ through Gate Access Points |
0 |
0 |
0 |
0 |
0 |
0 |
0 |
0 |
0 |
0 |
0 |
0 |
|
No. of SkyPier HSFs in compliance with Average Speed within 15 knots in SCZ |
0 |
0 |
0 |
0 |
0 |
0 |
0 |
0 |
0 |
0 |
0 |
0 |
|
Range of Daily Movement (including all SkyPier HSFs) |
2-3 |
1-3 |
2-4 |
2-3 |
2-3 |
2-3 |
2-3 |
5-11 |
9-11 |
1-7 |
3-4 |
2-4 |
Excerpted from Monthly and Quarterly EM&A Reports
2.10
Audit of the Construction and Associated Vessels
The audit of construction and associated vessels in accordance with the Marine Travel Route and Management Plan for Construction and Associated Vessel (MTRMP-CAV) has started since August 2016. ET has audited relevant information including AIS data, vessel tracks and other relevant records provided by the contractors to ensure that the contractors were fully complied with the requirements of the MTRMP-CAV. The Maritime Surveillance System (MSS) was launched in March 2017. The MSS automatically recorded deviation cases such as speeding, entering no entry zone, and not travelling through designated gates. ET conducted checking to ensure the MSS records all deviation cases accurately. The 3-month rolling programme submitted by contractors for construction vessel activities were also checked every month to ensure the logistic of construction vessels were well planned to achieve a practicable minimum. The IEC has also performed audit on the compliance of the requirements as part of the EM&A programme.
A total of 21 skipper training workshops were held by ET during the reporting period with 102 concerned captains of construction vessels associated with the 3RS contracts to familiarise them with the predefined routes, general education on local cetaceans, guidelines for avoiding adverse water quality impact, the required environmental practices / measures while operating construction and associated vessels under the Project, and guidelines for operating vessels safely in the presence of CWDs. Another 43 skipper training workshops were held with 86 captains by contractors’ Environmental Officers and competency tests were conducted subsequently with the trained captains by ET. In addition, ET participated Marine Management Liaison Group meetings to assist and resolve any marine issues which might be encountered under the Project.
2.11
External Stakeholder Engagement
In accordance with the EP’s requirements of setting up Community and Professional Liaison Groups, the AAHK has been continuing to proactively reach out to a wide spectrum of external stakeholders to update them on the environmental aspects of the Project and to seek their insights and views. In view of the COVID-19 pandemic, face-to-face meetings with the local community, relevant professional and green groups could not be arranged during the reporting period.
2.11.1
Community Liaison Groups
In order to enhance communication with the community in a proactive way, five Community Liaison Groups (CLGs) were set up in 2012 in the neighbouring districts of HKIA, namely Islands, Kwai Tsing, Shatin, Tsuen Wan and Tuen Mun. The CLGs are comprehensive platforms for the AAHK to update the community leaders about the detailed design, progress of construction and operation, and environmental monitoring and audit results of the Project, and listen to their views on various topics related to HKIA and the Project, including environmental matters. The AAHK also leverages on the CLGs to exchange views with the community on the latest airport developments, hence enhancing airport services and helping to contribute to the betterment of these districts. The CLGs have a total of about 120 members involving district councillors and community leaders. In view of the COVID-19 pandemic, face-to-face meetings could not be arranged during the reporting period.
2.11.2
Professional Liaison Group and Green Non-Governmental
Organizations
The Professional Liaison Group, comprising 18 members of relevant professionals and experts, was set up to enhance transparency and communication, as well as enquiries and complaints-handling on all environmental issues related to the Project; and to promote community cooperation and participation and implementation of suitable local environmental enhancement works that are included in the Environmental Permit. In view of the COVID-19 pandemic, face-to-face meetings could not be arranged during the reporting period.
Roundtable meetings with Green Non-Governmental Organizations (NGOs) were proactively arranged to facilitate exchanges on environmental issues related to the Project. Updates of the Project, including environmental monitoring and audit results and details on the implementation of environmental enhancement measures were shared with the participants. In view of the COVID-19 pandemic, face-to-face meetings could not be arranged during the reporting period.
2.11.3
Other Stakeholders
To encourage two-way communications with stakeholders and the community, a dedicated telephone hotline and email has been set up since December 2015. Seven enquiries were received via the hotline, and five enquiries were received via the dedicated email during the reporting period. The enquiries were followed up and responded by AAHK.
2.12
Review of the Key Assumptions Adopted in the EIA Report
With reference to Appendix E of the Manual, it is noted that the key assumptions adopted in approved EIA report for the construction phase are still valid and no major changes are involved. The environmental mitigation measures recommended in the approved EIA Report remain applicable and shall be implemented in undertaking construction works for the Project.
2.13
Key Environmental Issues for the Coming Reporting Period
The key environmental issues for the Project in the coming reporting period are expected to be associated with construction activities including:
· Generation of dust from construction works and stockpiles;
· Noise from operating equipment and machinery on-site;
· Generation of site surface runoffs and wastewater from activities on-site;
· Water quality from DCM works and marine filling;
· DEZ monitoring for ground improvement works (DCM works) and seawall construction;
· Implementation of MMWP for silt curtain deployment;
· Sorting, recycling, storage and disposal of general refuse and construction waste;
· Reuse of treated marine sediments from piling and excavation works;
· Management of chemicals and avoidance of oil spillage on-site; and
· Acoustic decoupling measures for equipment on marine vessels.
The implementation of required mitigation measures by the contractors will be monitored by the ET.
3
Report on Non-compliance,
Complaints, Notifications of Summons and Prosecutions
3.1
Compliance with Other Statutory Environmental Requirements
During the reporting period, environmental related licenses and permits required for the construction activities were checked. No non-compliance with environmental statutory requirements was recorded.
3.2
Analysis and Interpretation of Complaints, Notification of
Summons and Status of Prosecutions
3.2.1
Complaints
Twenty environmental complaints were received in the reporting period. The environmental complaints were attended to and investigations were conducted by the ET in accordance with the Manual and the Complaint Management Plan. The summary of the complaints and analysis is presented in Appendix G.
3.2.2
Notifications
of Summons or Status of Prosecution
A contractor reported in October 2021 that they had pleaded guilty in court and was fined by the court regarding summonses as laid by EPD upon a dust control emission incident for reclamation works in April 2021 contravening the Air Pollution Control Ordinance Cap. 311.
3.3
Cumulative Statistics
Cumulative statistics on exceedance, non-compliance, complaints, notifications of summons and status of prosecutions are summarized in Appendix G.
4
Conclusion and Recommendation
In the reporting period from 1 January 2021 to 31 December 2021, the EM&A programme has been implemented in accordance with the Manual of the Project. The EM&A works carried out during the reporting period include construction dust and noise measurements, water quality monitoring, vessel line-transect surveys, land-based theodolite tracking surveys supplemented with passive acoustic monitoring for CWD monitoring, waste monitoring, as well as environmental site inspections and landscape and visual monitoring for the Project’s construction works.
For construction noise, one monitoring result of construction noise triggered the relevant Limit Level, and the corresponding investigation was conducted as stipulated in the EM&A programme. The investigation findings concluded that the case was not due to the Project.
For water quality, the monitoring results for turbidity, total alkalinity and nickel obtained in the reporting period complied with the corresponding Action and Limit Levels stipulated in the EM&A programme. Relevant investigation and follow-up procedures were conducted according to the EM&A programme if the corresponding Action and Limit Levels were triggered. For DO, SS and chromium, some of the monitoring results triggered the relevant Action or Limit Levels in the reporting period, and the corresponding investigations were conducted accordingly. The investigation findings concluded that the cases were not related to the Project. To conclude, the construction activities in the reporting period did not introduce adverse impact to all water quality sensitive receivers.
The monitoring results in relation to the construction dust, waste, and CWD did not trigger their corresponding Action or Limit Levels during the reporting period.
A total of 5,368.2 km survey effort was conducted for the vessel line-transect monitoring for CWD during the 12-month monitoring period. A total of 151 groups of 493 CWDs were sighted in NWL, WL and SWL survey areas. No CWDs were recorded in NEL survey area. The combined encounter rates by number of dolphin sightings and by number of dolphins were 3.14 and 10.38 respectively. No triggering of Action and Limit Levels for encounter rates were recorded during the construction phase during 2021. Overall abundance of CWD in Hong Kong western waters was estimated at 34 dolphins in 2021 from line-transect analysis. CWD relative occurrence from land-based surveys around Lung Kwu Chau peaked in January, with fewer sightings during summer. Waters off Lung Kwu Chau continue to be habitat used primarily for travelling, foraging, and milling. Passive acoustic monitoring provides evidence that dolphins continued using the area around south of Sha Chau in 2021. The acoustic data also showed consistently higher levels of dolphin clicking activity at night compared with daytime, which may be indicative of foraging and concomitant use of echolocation by dolphins during hours of darkness.
No HSF movement between HKIA SkyPier and Zhuhai and Macau was recorded in the reporting period. The daily movements of all SkyPier HSFs in the reporting period, including those not using the diverted route, ranged between 1 and 11, which falls within the maximum daily cap number of 125. The annual daily average of all SkyPier HSF movements in the reporting period was 3.7, which falls within the annual daily average cap of 99 SkyPier HSF movements.
The audit of construction and associated vessels has started since August 2016. ET has conducted audit to ensure that the contractors were fully complied with the requirements of the MTRMP-CAV. The MSS was launched in March 2017. The MSS automatically recorded the deviation case such as speeding, entering no entry zone, not travelling through the designated gate. ET conducted checking to ensure the MSS records all deviation cases accurately. A total of 21 skipper training workshops were conducted by the ET during the reporting period with captains of construction vessels associated with 3RS contracts. Another 43 skipper training workshops were held by contractors’ Environmental Officers and competency tests were conducted subsequently with the trained captains by ET.
On the implementation of MMWP, silt curtains were in place by the contractors for marine filling and bored piling works and dolphin observers were deployed in accordance with the MMWP. On the implementation of DEZ Plan, dolphin observers were deployed by the contractors for continuous monitoring of the DEZ for DCM works, seawall construction and marine bored piling for approach lights in accordance with the DEZ Plan. Trainings for the dolphin observers on the implementation of MMWP and DEZ monitoring were provided by the ET prior to the aforementioned works. From the contractors’ MMWP observation records, no dolphins or other marine mammals were observed within or around the silt curtains during the reporting period. As for DEZ monitoring records, no dolphins or other marine mammals were observed within the DEZs in this reporting period. Audits of acoustic decoupling for construction vessels were also carried out by the ET during weekly site inspections.
External stakeholder engagement activities including setting up of a dedicated project website for the general public, organising of media workshop, and visit to the marine work site etc., were made available to update them on the environmental aspects of the Project and ensure transparent and engaging communication. Yet in view of the COVID-19 pandemic, face-to-face meetings with the local community, relevant professional and green groups could not be arranged during the reporting period.
Overall,
the recommended environmental mitigation measures, as included in the EM&A
programme, have been effectively implemented during the reporting period. Also,
the EM&A programme implemented by the ET has effectively monitored the
construction activities and ensure the proper implementation of mitigation
measures.
[1] The Manual is available on the Project’s dedicated website (accessible at: http://env.threerunwaysystem.com/en/index.html).