|
Expansion of Hong Kong International Airport into a Three-Runway System |
|
Construction Phase Monthly EM&A Report No.42 (For June 2019) |
|
3RS |
Three-Runway System |
|
AAHK |
Airport Authority Hong Kong |
|
AECOM |
AECOM Asia Company Limited |
|
AFCD |
Agriculture, Fisheries and Conservation Department |
|
AIS |
Automatic Information System |
|
ANI |
Encounter Rate of Number of Dolphins |
|
APM |
Automated People Mover |
|
AW |
Airport West |
|
BHS |
Baggage Handling System |
|
C&D |
Construction and Demolition |
|
CAP |
Contamination Assessment Plan |
|
CAR |
Contamination Assessment Report |
|
CNP |
Construction Noise Permit |
|
CWD |
Chinese White Dolphin |
|
DCM |
Deep Cement Mixing |
|
DEZ |
Dolphin Exclusion Zone |
|
DO |
Dissolved Oxygen |
|
EAR |
Ecological Acoustic Recorder |
|
EIA |
Environmental Impact Assessment |
|
EM&A |
Environmental Monitoring & Audit |
|
EP |
Environmental Permit |
|
EPD |
Environmental Protection Department |
|
ET |
Environmental Team |
|
FCZ |
Fish Culture Zone |
|
HDD |
Horizontal Directional Drilling |
|
HKBCF |
Hong Kong-Zhuhai-Macao Bridge Hong Kong Boundary Crossing Facilities |
|
HKIA |
Hong Kong International Airport |
|
HOKLAS |
Hong Kong Laboratory Accreditation Scheme |
|
HSF |
High Speed Ferry |
|
HVS |
High Volume Sampler |
|
IEC |
Independent Environmental Checker |
|
LKC |
Lung Kwu Chau |
|
MMHK |
Mott MacDonald Hong Kong Limited |
|
MMWP |
Marine Mammal Watching Plan |
|
MSS |
Marine Surveillance System |
|
MTRMP-CAV |
Marine Travel Routes and Management Plan for Construction and Associated Vessel |
|
NEL |
Northeast Lantau |
|
NWL |
Northwest Lantau |
|
PAM |
Passive Acoustic Monitoring |
|
PVD |
Prefabricated Vertical Drain |
|
SC |
Sha Chau |
|
SCLKCMP |
Sha Chau and Lung Kwu Chau Marine Park |
|
SS |
Suspended Solids |
|
SSSI |
Site of Special Scientific Interest |
|
STG |
Encounter Rate of Number of Dolphin Sightings |
|
SWL |
Southwest Lantau |
|
T2 |
Terminal 2 |
|
The Project |
The Expansion of Hong Kong International Airport into a Three-Runway System |
|
The SkyPier Plan |
Marine Travel Routes and Management Plan for High Speed Ferries of SkyPier |
|
The Manual |
The Updated EM&A Manual |
|
TSP |
Total Suspended Particulates |
|
WL |
West Lantau |
|
WMP |
Waste Management Plan |
The “Expansion of Hong Kong International Airport into a Three-Runway System” (the Project) serves to meet the future air traffic demands at Hong Kong International Airport (HKIA). On 7 November 2014, the Environmental Impact Assessment (EIA) Report (Register No.: AEIAR-185/2014) for the Project was approved and an Environmental Permit (EP) (Permit No.: EP-489/2014) was issued for the construction and operation of the Project.
Airport Authority Hong Kong (AAHK) commissioned Mott MacDonald Hong Kong Limited (MMHK) to undertake the role of Environmental Team (ET) for carrying out the Environmental Monitoring & Audit (EM&A) works during the construction phase of the Project in accordance with the Updated EM&A Manual (the Manual).
This is the 42nd Construction Phase Monthly EM&A Report for the Project which summarizes the monitoring results and audit findings of the EM&A programme during the reporting period from 1 to 30 June 2019.
Key Activities in the Reporting Period
The key activities of the Project carried out in the reporting period included reclamation works and land-side works. Reclamation works included deep cement mixing (DCM) works, marine filling, seawall construction, and prefabricated vertical drain (PVD) installation. Land-side works involved mainly foundation and substructure work for Terminal 2 expansion, modification and tunnel work for Automated People Mover (APM) and Baggage Handling System (BHS), and preparation work for utilities, with activities include site establishment, site office construction, road and drainage works, cable ducting, demolition, piling, and excavation works.
EM&A Activities Conducted in the Reporting Period
The monthly EM&A programme was undertaken in accordance with the Manual of the Project. Summary of the monitoring activities during this reporting period is presented as below:
|
Monitoring Activities |
Number of Sessions |
|
1-hour Total Suspended Particulates (TSP) air quality monitoring |
30 |
|
Noise monitoring |
16 |
|
Water quality monitoring |
13 |
|
Vessel line-transect surveys for Chinese White Dolphin (CWD) monitoring |
2 |
|
Land-based theodolite tracking survey effort for CWD monitoring |
3 |
Environmental auditing works, including weekly site inspections of construction works conducted by the ET and bi-weekly site inspections conducted by the Independent Environmental Checker (IEC), audit of SkyPier High Speed Ferries (HSF), audit of construction and associated vessels, and audit of implementation of Marine Mammal Watching Plan (MMWP) and Dolphin Exclusion Zone (DEZ) Plan, were conducted in the reporting period. Based on information including ET’s observations, records of Marine Surveillance System (MSS), and contractors’ site records, it is noted that environmental pollution control and mitigation measures were properly implemented and construction activities of the Project in the reporting period did not introduce adverse impacts to the sensitive receivers.
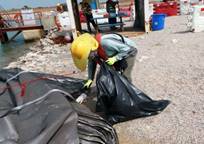
Snapshots of EM&A Activities in the Reporting Period
|
|
|
|
|
Training and QA/QC Check of Surveyors by CWD Experts |
Land-Based Theodolite Tracking Survey for CWD at Lung Kwu Chau |
Cleaning Along the Seawall Conducted by Contractor |


Results of Impact Monitoring
The monitoring works for construction dust, construction noise, water quality, construction waste, landscape & visual, and CWD were conducted during the reporting period in accordance with the Manual.
Monitoring results of construction dust, construction noise, water quality, construction waste, and CWD did not trigger the corresponding Action and Limit Levels in the reporting period.
The water quality monitoring results for turbidity, total alkalinity, SS, and chromium obtained during the reporting period were within the corresponding Action and Limit Levels stipulated in the EM&A programme. Relevant investigation and follow-up actions will be conducted according to the EM&A programme if the corresponding Action and Limit Levels are triggered. For dissolved oxygen (DO) and nickel, some testing results triggered the relevant Action or Limit Levels, and the corresponding investigations were conducted accordingly. The investigation findings concluded that the case was not related to the Project. To conclude, the construction activities in the reporting period did not introduce adverse impact to all water quality sensitive receivers.
Summary of Upcoming Key Issues
Advanced Works:
Contract P560 (R) Aviation Fuel Pipeline Diversion Works
● Stockpiling of compressed materials
DCM Works:
Contract 3201 and 3205 DCM Works
● DCM works
Reclamation Works:
Contract 3206 Main Reclamation Works
● Land base ground improvement works;
● Seawall construction; and
● Marine filling.
Airfield Works:
Contract 3301 North Runway Crossover Taxiway
● Cable ducting works;
● Subgrade compaction and paving works;
● Drainage construction works;
● Operation of aggregate mixing facility; and
● Precast of duct bank and fabrication of steel works.
Contract 3302 Eastern Vehicular Tunnel Advance Works
● Site survey and cable laying; and
● Site establishment.
Contract 3303 Third Runway and Associated Works
● Site establishment.
Third Runway Concourse and Integrated Airport Centres Works:
Contract 3402 New Integrated Airport Centres Enabling Works
● Site establishment;
● Installation of sheet and pipe piles; and
● Manhole and pipe construction works.
Terminal 2 Expansion Works:
Contract 3501 Antenna Farm and Sewage Pumping Station
● Drainage works;
● Boring works; and
● Pipe installation.
Contract 3502 Terminal 2 Automated People Mover (APM) Depot Modification Works
● Site clearance; and
● Painting and fitting out works.
Contract 3503 Terminal 2 Foundation and Substructure Works
● Site establishment;
● Demolition works;
● Utilities, drainage, and road work; and
● Piling and structure works.
Automated People Mover (APM) Works:
Contract 3602 Existing APM System Modification Works
● Site establishment; and
● Modification works at APM depot.
Airport Support Infrastructure & Logistic Works:
Contract 3801 APM and BHS Tunnels on Existing Airport Island
● Site establishment;
● Cofferdam installation and construction of box culvert;
● Rising main installation;
● Drilling and grouting works;
● Piling and foundation works
● Demolition works; and
● Site clearance.
The following table summarizes the key findings of the EM&A programme during the reporting period:
|
Yes |
No |
Details |
Analysis / Recommendation / Remedial Actions |
|
|
Breach of Limit Level^ |
|
√ |
No breach of Limit Level was recorded. |
Nil |
|
Breach of Action Level^ |
|
√ |
No breach of Action Level was recorded. |
Nil |
|
|
√ |
No construction activities-related complaint was received |
Nil |
|
|
Notification of any summons and status of prosecutions |
|
√ |
No notification of summons or prosecution was received.
|
Nil |
|
Change that affect the EM&A |
|
√ |
There was no change to the construction works that may affect the EM&A |
Nil |
Note:
^ Only triggering of Action or Limit Level found related to Project works is counted as Breach of Action or Limit Level.
1
Introduction
1.1
Background
On 7 November 2014, the Environmental Impact Assessment (EIA) Report (Register No.: AEIAR-185/2014) for the “Expansion of Hong Kong International Airport into a Three-Runway System” (the Project) was approved and an Environmental Permit (EP) (Permit No.: EP-489/2014) was issued for the construction and operation of the Project.
Airport Authority Hong Kong (AAHK) commissioned Mott MacDonald Hong Kong Limited (MMHK) to undertake the role of Environmental Team (ET) for carrying out the Environmental Monitoring & Audit (EM&A) works during the construction phase of the Project in accordance with the Updated EM&A Manual (the Manual) submitted under EP Condition 3.1. AECOM Asia Company Limited (AECOM) was employed by AAHK as the Independent Environmental Checker (IEC) for the Project.
The Project covers the expansion of the existing airport into a three-runway system (3RS) with key project components comprising land formation of about 650 ha and all associated facilities and infrastructure including taxiways, aprons, aircraft stands, a passenger concourse, an expanded Terminal 2, all related airside and landside works and associated ancillary and supporting facilities. The submarine aviation fuel pipelines and submarine power cables also require diversion as part of the works.
Construction of the Project is to proceed in the general order of diversion of the submarine aviation fuel pipelines, diversion of the submarine power cables, land formation, and construction of infrastructure, followed by construction of superstructures.
The updated overall phasing programme of all construction works was presented in Appendix A of the Construction Phase Monthly EM&A Report No. 7 and the contract information was presented in Appendix A.
1.2
Scope of this Report
This is the 42nd Construction Phase Monthly EM&A Report for the Project which summarizes the key findings of the EM&A programme during the reporting period from 1 to 30 June 2019.
1.3
Project Organisation
The Project’s organization structure presented in Appendix B of the Construction Phase Monthly EM&A Report No.1 remained unchanged during the reporting period. Contact details of the key personnel are presented in Table 1.1.
Table 1.1: Contact Information of Key Personnel
|
Party |
Position |
Name |
Telephone |
|
Project Manager’s Representative (Airport Authority Hong Kong) |
Principal Manager, Environment |
Lawrence Tsui |
2183 2734 |
|
Environmental Team (ET) (Mott MacDonald Hong Kong Limited) |
Environmental Team Leader |
Terence Kong |
2828 5919 |
|
|
Deputy Environmental Team Leader |
Heidi Yu |
2828 5704 |
|
|
Deputy Environmental Team Leader |
Daniel Sum |
2585 8495 |
|
Independent Environmental Checker (IEC) (AECOM Asia Company Limited) |
Independent Environmental Checker |
Jackel Law |
3922 9376
|
|
|
Deputy Independent Environmental Checker |
Roy Man |
3922 9141 |
Advanced Works:
|
Party |
Position |
Name |
Telephone |
|
Contract P560(R) Aviation Fuel Pipeline Diversion Works (Langfang Huayuan Mechanical and Electrical Engineering Co., Ltd.) |
Project Manager
|
Wei Shih
|
2117 0566
|
|
|
Environmental Officer |
Lyn Liu
|
5172 6543
|
Deep Cement Mixing (DCM) Works:
|
Party |
Position |
Name |
Telephone |
|
Contract 3201 DCM (Package 1) (Penta-Ocean-China State-Dong-Ah Joint Venture) |
Project Director
|
Tsugunari Suzuki
|
9178 9689 |
|
|
Environmental Officer
|
Hiu Yeung Tang
|
6329 3513 |
|
Contract 3202 DCM (Package 2) (Samsung-BuildKing Joint Venture) |
Project Manager |
Ilkwon Nam
|
9643 3117 |
|
Contract 3203 DCM (Package 3) (Sambo E&C Co., Ltd) |
Project Manager
|
Eric Kan
|
9014 6758 |
|
Contract 3204 DCM (Package 4) (CRBC-SAMBO Joint Venture) |
Project Manager |
Kyung-Sik Yoo
|
9683 8697
|
|
Contract 3205 DCM (Package 5) (Bachy Soletanche - Sambo Joint Venture) |
Deputy Project Director |
Min Park |
9683 0765 |
|
Environmental Officer |
Lawrence Chan |
5107 5961 |
Reclamation Works:
|
Party |
Position |
Name |
Telephone |
|
Contract 3206 Main Reclamation Works (ZHEC-CCCC-CDC Joint Venture)
|
Project Manager |
Kim Chuan Lim
|
3763 1509 |
|
|
Environmental Officer |
Kwai Fung Wong |
3763 1452 |
Airfield Works:
|
Party |
Position |
Name |
Telephone |
|
Contract 3301 North Runway Crossover Taxiway (FJT-CHEC-ZHEC Joint Venture) |
Deputy Project Director |
Kin Hang Chung |
9800 0048 |
|
|
Environmental Officer |
Nelson Tam |
9721 3942 |
|
Contract 3302 Eastern Vehicular Tunnel Advance Works (China Road and Bridge Corporation) |
Project Manager
|
Wan Cheung Lee
|
6100 6075
|
|
|
Environmental Officer |
Wilmer Ng |
3919 9421 |
|
Contract 3303 Third Runway and Associated Works (SAPR Joint Venture) |
Project Manager |
Steven Meredith |
6109 1813 |
|
|
Environmental Officer |
Pan Fong |
9436 9435 |
Third Runway Concourse and Integrated Airport Centres Works:
|
Party |
Position |
Name |
Telephone |
|
Contract 3402 New Integrated Airport Centres Enabling Works (Wing Hing Construction Co., Ltd.) |
Contract Manager |
Michael Kan |
9206 0550 |
|
|
Environmental Officer |
Lisa He |
5374 3418 |
Terminal 2 (T2) Expansion Works:
|
Party |
Position |
Name |
Telephone |
|
Contract 3501 Antenna Farm and Sewage Pumping Station (Build King Construction Ltd.) |
Project Manager
|
Vincent Kwan
|
9833 1313
|
|
|
Environmental Officer |
Edward Tam |
9287 8270 |
|
Contract 3502 Terminal 2 APM Depot Modification Works (Build King Construction Ltd.) |
Project Manager |
David Ng |
9010 7871 |
|
|
Environmental Officer |
Chun Pong Chan |
9187 7118 |
|
Contract 3503 Terminal 2 Foundation and Substructure Works (Leighton – Chun Wo Joint Venture) |
Project Manager |
Eric Wu |
3973 1718 |
|
|
Environmental Officer |
Stephen Tsang |
5508 6361 |
|
Automated People Mover (APM) Works: |
|||
|
Party |
Position |
Name |
Telephone |
|
Contract 3602 Existing APM System Modification Works (Niigata Transys Co., Ltd.) |
Project Manager |
Kunihiro Tatecho |
9755 0351 |
|
|
Environmental Officer |
Arthur Wong |
9170 3394 |
|
Baggage Handling System (BHS) Works: |
||||
|
Party |
Position |
Name |
Telephone |
|
|
Contract 3603 3RS Baggage Handling System (VISH Consortium) |
Project Manager |
Andy Ng |
9102 2739 |
|
|
Environmental Officer |
Eric Ha |
9215 3432 |
|
|
|
Airport Support Infrastructure and Logistic Works: |
|||
|
Party |
Position |
Name |
Telephone |
|
Contract 3801 APM and BHS Tunnels on Existing Airport Island (China State Construction Engineering (Hong Kong) Ltd.) |
Project Manager |
Tony Wong |
9642 8672 |
|
Environmental Officer |
Fredrick Wong |
9842 2703 |
|
1.4
Summary of
Construction Works
The key activities of the Project carried out in the reporting period included reclamation works and land-side works. Reclamation works included deep cement mixing (DCM) works, marine filling, seawall construction, and prefabricated vertical drain (PVD) installation. Land-side works involved mainly foundation and substructure work for Terminal 2 expansion, modification and tunnel work for Automated People Mover (APM) and Baggage Handling System (BHS) systems, and preparation work for utilities, with activities include site establishment, site office construction, road and drainage works, cable ducting, demolition of existing facilities, piling, and excavation works.
The locations of key construction activities are presented in Figure 1.1. Latest layout of the enhanced silt curtain deployed is presented in Figure 1.2.
1.5
Summary of EM&A Programme Requirements
The status for all environmental aspects are presented in Table 1.2. The EM&A requirements remained unchanged during the reporting period and details can be referred to Table 1.2 of the Construction Phase Monthly EM&A Report No. 1.
Table 1.2: Summary of status for all environmental aspects under the Updated EM&A Manual
|
Parameters |
Status |
|
Air Quality |
|
|
Baseline Monitoring |
The baseline air quality monitoring result has been reported in Baseline Monitoring Report and submitted to EPD under EP Condition 3.4. |
|
Impact Monitoring |
On-going |
|
Noise |
|
|
Baseline Monitoring |
The baseline noise monitoring result has been reported in Baseline Monitoring Report and submitted to EPD under EP Condition 3.4. |
|
Impact Monitoring |
On-going |
|
Water Quality |
|
|
General Baseline Water Quality Monitoring for reclamation, water jetting and field joint works |
The baseline water quality monitoring result has been reported in Baseline Water Quality Monitoring Report and submitted to EPD under EP Condition 3.4. |
|
General Impact Water Quality Monitoring for reclamation, water jetting and field joint works |
On-going |
|
Initial Intensive Deep Cement Mixing (DCM) Water Quality Monitoring |
The Initial Intensive DCM Monitoring Report was submitted and approved by EPD in accordance with the Detailed Plan on DCM. |
|
Regular DCM Water Quality Monitoring |
On-going |
|
Waste Management |
|
|
Waste Monitoring |
On-going |
|
Land Contamination |
|
|
Supplementary Contamination Assessment Plan (CAP) |
The Supplementary CAP was submitted to EPD pursuant to EP Condition 2.20. |
|
Contamination Assessment Report (CAR) for Golf Course |
The CAR for Golf Course was submitted to EPD. |
|
Terrestrial Ecology |
|
|
Pre-construction Egretry Survey Plan |
The Egretry Survey Plan was submitted and approved by EPD under EP Condition 2.14. |
|
Ecological Monitoring |
The terrestrial ecological monitoring at Sheung Sha Chau was completed in January 2019. |
|
Marine Ecology |
|
|
Pre-Construction Phase Coral Dive Survey |
The Coral Translocation Plan was submitted and approved by EPD under EP Condition 2.12. |
|
Coral Translocation |
The coral translocation was completed. |
|
Post-Translocation Coral Monitoring |
The post-translocation monitoring programme according to the Coral Translocation Plan was completed in April 2018. |
|
Chinese White Dolphins (CWD) |
|
|
Vessel Survey, Land-based Theodolite Tracking and Passive Acoustic Monitoring (PAM) |
|
|
Baseline Monitoring |
Baseline CWD results were reported in the CWD Baseline Monitoring Report and submitted to EPD in accordance with EP Condition 3.4. |
|
Impact Monitoring |
On-going |
|
Landscape & Visual |
|
|
Landscape & Visual Plan |
The Landscape & Visual Plan was submitted to EPD under EP Condition 2.18 |
|
Baseline Monitoring |
The baseline landscape & visual monitoring result has been reported in Baseline Monitoring Report and submitted to EPD under EP Condition 3.4. |
|
Impact Monitoring |
On-going |
|
Environmental Auditing |
|
|
Regular site inspection |
On-going |
|
Marine Mammal Watching Plan (MMWP) implementation measures |
On-going |
|
Dolphin Exclusion Zone (DEZ) Plan implementation measures |
On-going |
|
SkyPier High Speed Ferries (HSF) implementation measures |
On-going |
|
Construction and Associated Vessels Implementation measures |
On-going |
|
Complaint Hotline and Email channel |
On-going |
|
Environmental Log Book |
On-going |
Taking into account the construction works in this reporting period, impact monitoring of air quality, noise, water quality, waste management, landscape & visual, and CWD were carried out in the reporting period.
The EM&A programme also involved weekly site inspections and related auditing conducted by the ET for checking the implementation of the required environmental mitigation measures recommended in the approved EIA Report. To promote the environmental awareness and enhance the environmental performance of the contractors, environmental trainings and regular environmental management meetings were conducted during the reporting period, which are summarized as below:
● Nine environmental management meetings for EM&A review with works contracts: 6, 12, 21, 25, 26, 27, and 28 June 2019
The EM&A programme has been following the recommendations presented in the approved EIA Report and the Manual. A summary of implementation status of the environmental mitigation measures for the construction phase of the Project during the reporting period is provided in Appendix B.
2 Air Quality Monitoring
Air quality monitoring of 1-hour Total Suspended Particulates (TSP) was conducted three times every six days at two representative monitoring stations in the vicinity of air sensitive receivers in Tung Chung and villages in North Lantau in accordance with the Manual. Table 2.1 describes the details of the monitoring stations. Figure 2.1 shows the locations of the monitoring stations.
Table 2.1: Locations of Impact Air Quality Monitoring Stations
|
Monitoring Station |
Location |
|
AR1A |
Man Tung Road Park |
|
AR2 |
Village House at Tin Sum |
2.1
Action and Limit
Levels
In accordance with the Manual, baseline air quality monitoring of 1-hour TSP levels at the two air quality monitoring stations were established as presented in the Baseline Monitoring Report. The Action and Limit Levels of the air quality monitoring stipulated in the EM&A programme for triggering the relevant investigation and follow-up procedures under the programme are provided in Table 2.2.
Table 2.2: Action and Limit Levels of Air Quality Monitoring
|
Monitoring Station |
Action Level (mg/m3) |
Limit Level (mg/m3) |
|
AR1A |
306 |
500 |
|
AR2 |
298 |
2.2
Monitoring Equipment
Portable direct reading dust meter was used to carry out the air quality monitoring. Details of equipment used in the reporting period are given in Table 2.3.
Table 2.3: Air Quality Monitoring Equipment
|
Brand and Model |
Last Calibration Date |
Calibration Certificate Provided in |
|
|
Portable direct reading dust meter (Laser dust monitor) |
SIBATA LD-3B-1 |
2 Oct 2018 |
Monthly EM&A Report No. 35, Appendix D |
|
SIBATA LD-3B-2 (Serial No. 296098) |
16 Oct 2018 |
2.3
Monitoring
Methodology
2.3.1
Measuring Procedure
The measurement procedures involved in the impact air quality monitoring can be summarised as follows:
a. The portable direct reading dust meter was mounted on a tripod at a height of 1.2 m above the ground.
b. Prior to the measurement, the equipment was set up for 1 minute span check and 6 second background check.
c. The one hour dust measurement was started. Site conditions and dust sources at the nearby area were recorded on a record sheet.
d. When the measurement completed, the “Count” reading per hour was recorded for result calculation.
2.3.2
Maintenance and Calibration
The portable direct reading dust meter is calibrated every year against high volume sampler (HVS) to check the validity and accuracy of the results measured by direct reading method. The calibration record of the HVS provided in Appendix D of the Construction Phase Monthly EM&A Report No. 35, and the calibration certificates of portable direct reading dust meters listed in Table 2.3 are still valid.
2.4
Summary of Monitoring Results
The air quality monitoring schedule involved in the reporting period is provided in Appendix C.
The air quality monitoring results in the reporting period are summarized in Table 2.4. Detailed impact monitoring results are presented in Appendix D.
Table 2.4: Summary of Air Quality Monitoring Results
|
Monitoring Station |
1-hr TSP Concentration Range (mg/m3) |
Action Level (mg/m3) |
Limit Level (mg/m3) |
|
AR1A |
9 – 41 |
306 |
500 |
|
AR2 |
10 – 39 |
298 |
The monitoring results were within the corresponding Action and Limit Levels at all monitoring stations in the reporting period.
General meteorological conditions throughout the impact monitoring period were recorded. Wind data including wind speed and wind direction for each monitoring day were collected from the Chek Lap Kok Wind Station.
2.5
Conclusion
No dust emission source from Project activities was observed during impact air quality monitoring. Major sources of dust observed at the monitoring stations during the monitoring sessions were local air pollution and nearby traffic emissions. It is considered that the monitoring work in the reporting period is effective and there was no adverse impact attributable to the Project activities.
3
Noise Monitoring
Noise monitoring in the form of 30-minute measurements of Leq, L10, and L90 levels was conducted once per week between 0700 and 1900 on normal weekdays at four representative monitoring stations in the vicinity of noise sensitive receivers in Tung Chung and villages in North Lantau in accordance with the Manual. Table 3.1 describes the details of the monitoring stations. Figure 2.1 shows the locations of the monitoring stations.
Table 3.1: Locations of Impact Noise Monitoring Stations
|
Monitoring Station |
Location |
Type of measurement |
|
NM1A |
Man Tung Road Park |
Free field |
|
NM2(1) |
Tung Chung West Development |
To be determined |
|
NM3A(2) |
Site Office |
Facade |
|
NM4 |
Ching Chung Hau Po Woon Primary School |
Free field |
|
NM5 |
Village House in Tin Sum |
Free field |
|
NM6 |
House No. 1, Sha Lo Wan |
Free field |
Note:
(1) As described in Section 4.3.3 of the Manual, noise monitoring at NM2 will only commence after occupation of the future Tung Chung West Development.
(2) According to Section 4.3.3 of the Manual, the noise monitoring at NM3A was temporarily suspended starting from 1 Sep 2018 and would be resumed with the completion of the Tung Chung East Development.
3.1
Action and Limit Levels
In accordance with the Manual, baseline noise levels at the noise monitoring stations were established as presented in the Baseline Monitoring Report. The Action and Limit Levels of the noise monitoring stipulated in the EM&A programme for triggering the relevant investigation and follow-up procedures under the programme are provided in Table 3.2.
Table 3.2: Action and Limit Levels for Noise Monitoring
|
Monitoring Stations |
Time Period |
Action Level |
Limit Level, Leq(30mins) dB(A) |
|
NM1A, NM2, NM3A, NM4, NM5 and NM6 |
0700-1900 hours on normal weekdays |
When one documented complaint is received from any one of the sensitive receivers |
75 dB(A)(1) |
Note:
(1) Reduced to 70dB(A) for school and 65dB(A) during school examination periods for NM4.
3.2
Monitoring
Equipment
Noise monitoring was performed using sound level meter at each designated monitoring station. The sound level meters deployed comply with the International Electrotechnical Commission Publications 651:1979 (Type 1) and 804:1985 (Type 1) specifications. Acoustic calibrator was used to check the sound level meters by a known sound pressure level for field measurement. Details of equipment used in the reporting period are given in Table 3.3.
Table 3.3: Noise Monitoring Equipment
|
Equipment |
Brand and Model |
Last Calibration Date |
Calibration Certificate Provided in |
|
Integrated Sound Level Meter |
NTi XL2-M2211 (Microphone Serial No.7681; |
28 Aug 2018 |
Monthly EM&A Report No. 36, Appendix E |
|
Rion NL-52 (Serial No. 01287679) |
6 Feb 2019 |
Monthly EM&A Report No. 39, Appendix D |
|
|
Acoustic Calibrator |
Castle GA607 (Serial No. 040162) |
7 Aug 2018 |
Monthly EM&A Report No. 35, Appendix D |
|
Casella CEL-120/1 (Serial No. 2383737) |
17 Oct 2018 |
3.3
Monitoring
Methodology
3.3.1
Monitoring Procedure
The monitoring procedures involved in the noise monitoring can be summarised as follows:
a. The sound level meter was set on a tripod at least a height of 1.2 m above the ground for free-field measurements at monitoring stations NM1A, NM4, NM5 and NM6. A correction of +3 dB(A) was applied to the free field measurements.
b. Façade measurements were made at the monitoring station NM3A.
c. Parameters such as frequency weighting, time weighting and measurement time were set.
d. Prior to and after each noise measurement, the meter was calibrated using the acoustic calibrator. If the difference in the calibration level before and after measurement was more than 1 dB(A), the measurement would be considered invalid and repeat of noise measurement would be required after re-calibration or repair of the equipment.
e. During the monitoring period, Leq, L10 and L90 were recorded. In addition, site conditions and noise sources were recorded on a record sheet.
f. Noise measurement results were corrected with reference to the baseline monitoring levels.
g. Observations were recorded when high intrusive noise (e.g. dog barking, helicopter noise) was observed during the monitoring.
3.3.2
Maintenance and Calibration
The maintenance and calibration procedures are summarised below:
a. The microphone head of the sound level meter was cleaned with soft cloth at regular intervals.
b. The meter and calibrator were sent to the supplier or laboratory accredited under Hong Kong Laboratory Accreditation Scheme (HOKLAS) to check and calibrate at yearly intervals.
Calibration certificates of the sound level meters and acoustic calibrators used in the noise monitoring listed in Table 3.3 are still valid.
3.4
Summary of Monitoring Results
The noise monitoring schedule involved in the reporting period is provided in Appendix C.
The noise monitoring results in the reporting period are summarized in Table 3.4. Detailed impact monitoring results are presented in Appendix D.
Table 3.4: Summary of Construction Noise Monitoring Results
|
Monitoring Station |
Noise Level Range, dB(A) Leq (30 mins) |
Limit Level, dB(A) Leq (30 mins) |
|
NM1A(1) |
72 – 73 |
75 |
|
NM4(1) |
63 – 64 |
70(2) |
|
NM5(1) |
53 – 62 |
75 |
|
NM6(1) |
66 – 73 |
75 |
Notes:
(1) +3 dB(A) Façade correction included;
(2) Reduced to 65 dB(A) during school examination periods at NM4. School examination and Territory-wide System Assessment (TSA) took place from 1 to 6 June and from 11 to 12 June in this reporting period respectively.
No complaints were received from any sensitive receiver that triggered the Action Level. All monitoring results were also within the corresponding Limit Levels at all monitoring stations in the reporting period.
3.5
Conclusion
As the construction activities were far away from the monitoring stations, major sources of noise dominating the monitoring stations observed during the construction noise impact monitoring were traffic noise near NM1A, school activities near NM4, aircraft and helicopter noise near NM5 and NM6 during this reporting period. It is considered that the monitoring work during the reporting period was effective and there was no adverse impact attributable to the Project activities.
4 Water Quality Monitoring
Water quality monitoring of DO, pH, temperature, salinity, turbidity, suspended solids (SS), total alkalinity, chromium, and nickel was conducted three days per week, at mid-ebb and mid-flood tides, at a total of 23 water quality monitoring stations, comprising 12 impact (IM) stations, 8 sensitive receiver (SR) stations and 3 control (C) stations in the vicinity of water quality sensitive receivers around the airport island in accordance with the Manual. The purpose of water quality monitoring at the IM stations is to promptly capture any potential water quality impact from the Project before it could become apparent at sensitive receivers (represented by the SR stations). Table 4.1 describes the details of the monitoring stations. Figure 4.1 shows the locations of the monitoring stations.
Table 4.1: Monitoring Locations and Parameters of Impact Water Quality Monitoring
|
Monitoring Station |
Description |
Coordinates |
Parameters |
|
|
|
|
Easting |
Northing |
|
|
C1 |
Control Station |
804247 |
815620 |
General Parameters DO, pH, Temperature, Salinity, Turbidity, SS
DCM Parameters Total Alkalinity, Heavy Metals(2) |
|
C2 |
Control Station |
806945 |
825682 |
|
|
C3(3) |
Control Station |
817803 |
822109 |
|
|
IM1 |
Impact Station |
807132 |
817949 |
|
|
IM2 |
Impact Station |
806166 |
818163 |
|
|
IM3 |
Impact Station |
805594 |
818784 |
|
|
IM4 |
Impact Station |
804607 |
819725 |
|
|
IM5 |
Impact Station |
804867 |
820735 |
|
|
IM6 |
Impact Station |
805828 |
821060 |
|
|
IM7 |
Impact Station |
806835 |
821349 |
|
|
IM8 |
Impact Station |
808140 |
821830 |
|
|
IM9 |
Impact Station |
808811 |
822094 |
|
|
IM10 |
Impact Station |
809794 |
822385 |
|
|
IM11 |
Impact Station |
811460 |
822057 |
|
|
IM12 |
Impact Station |
812046 |
821459 |
|
|
SR1A(1) |
Hong Kong-Zhuhai-Macao Bridge Hong Kong Boundary Crossing Facilities (HKBCF) Seawater Intake for cooling |
812660 |
819977 |
General Parameters DO, pH, Temperature, Salinity, Turbidity, SS |
|
SR2(3) |
Planned marine park / hard corals at The Brothers / Tai Mo To |
814166 |
821463 |
General Parameters DO, pH, Temperature, Salinity, Turbidity, SS
DCM Parameters Total Alkalinity, Heavy Metals(2)(4) |
|
SR3 |
Sha Chau and Lung Kwu Chau Marine Park / fishing and spawning grounds in North Lantau |
807571 |
822147 |
General Parameters DO, pH, Temperature, Salinity, Turbidity, SS
|
|
SR4A |
Sha Lo Wan |
807810 |
817189 |
|
|
SR5A |
San Tau Beach SSSI |
810696 |
816593 |
|
|
SR6 |
Tai Ho Bay, Near Tai Ho Stream SSSI |
814663 |
817899 |
|
|
SR7 |
Ma Wan Fish Culture Zone (FCZ) |
823742 |
823636 |
|
|
SR8(5) |
Seawater Intake for cooling at Hong Kong International Airport (East) |
811623 |
820390 |
|
Notes:
(1) With the operation of HKBCF, water quality monitoring at SR1A station was commenced on 25 October 2018. To better reflect the water quality in the immediate vicinity of the intake, the monitoring location of SR1A has been shifted closer to the intake starting from 5 January 2019.
(2) Details of selection criteria for the two heavy metals for regular DCM monitoring refer to the Detailed Plan on Deep Cement Mixing available on the dedicated 3RS website (http://env.threerunwaysystem.com/en/ep-submissions.html). DCM specific water quality monitoring parameters (total alkalinity and heavy metals) were only conducted at C1 to C3, SR2, and IM1 to IM12.
(3) According to the Baseline Water Quality Monitoring Report, C3 station is not adequately representative as a control station of impact/ SR stations during the flood tide. The control reference has been changed from C3 to SR2 from 1 September 2016 onwards.
(4) Total alkalinity and heavy metals results are collected at SR2 as a control station for regular DCM monitoring.
(5) The monitoring location for SR8 is subject to further changes due to silt curtain arrangements and the progressive relocation of this seawater intake.
4.1
Action and Limit Levels
In accordance with the Manual, baseline water quality levels at the abovementioned representative water quality monitoring stations were established as presented in the Baseline Water Quality Monitoring Report. The Action and Limit Levels of general water quality monitoring and regular DCM monitoring stipulated in the EM&A programme for triggering the relevant investigation and follow-up procedures under the programme are provided in Table 4.2. The control and impact stations during ebb tide and flood tide for general water quality monitoring and regular DCM monitoring are presented in Table 4.3.
Table 4.2: Action and Limit Levels for General Water Quality Monitoring and Regular DCM Monitoring
|
Parameters |
Action Level (AL) |
Limit Level (LL) |
|||
|
Action and Limit Levels for general water quality monitoring and regular DCM monitoring (excluding SR1A & SR8) |
|||||
|
General Water Quality Monitoring |
DO in mg/L (Surface, Middle & Bottom) |
Surface and Middle 4.5 mg/L |
Surface and Middle 4.1 mg/L 5 mg/L for Fish Culture Zone (SR7) only |
||
|
Bottom 3.4 mg/L |
Bottom 2.7 mg/L |
||||
|
Suspended Solids (SS) in mg/L |
23 |
or 120% of upstream control station at the same tide of the same day, whichever is higher |
37 |
or 130% of upstream control station at the same tide of the same day, whichever is higher |
|
|
Turbidity in NTU |
22.6 |
36.1 |
|||
|
Regular DCM Monitoring |
Total Alkalinity in ppm |
95 |
99 |
||
|
Representative Heavy Metals for regular DCM monitoring (Chromium) in µg/L |
0.2 |
0.2 |
|||
|
Representative Heavy Metals for regular DCM monitoring (Nickel) in µg/L |
3.2 |
|
3.6 |
|
|
|
Action and Limit Levels SR1A |
|
|
|
||
|
SS (mg/l) |
33 |
|
42 |
|
|
|
Action and Limit Levels SR8 |
|
|
|
|
|
|
SS (mg/l) |
52 |
|
60 |
|
|
Notes:
(1) For DO measurement, non-compliance occurs when monitoring result is lower than the limits.
(2) For parameters other than DO, non-compliance of water quality results when monitoring results is higher than the limits.
(3) Depth-averaged results are used unless specified otherwise.
(4) Details of selection criteria for the two heavy metals for regular DCM monitoring refer to the Detailed Plan on Deep Cement Mixing available on the dedicated 3RS website (http://env.threerunwaysystem.com/en/ep-submissions.html)
(5) The Action and Limit Levels for the two representative heavy metals chosen will be the same as that for the intensive DCM monitoring.
Table 4.3: The Control and Impact Stations during Flood Tide and Ebb Tide for General Water Quality Monitoring and Regular DCM Monitoring
|
Control Station |
Impact Stations |
|
Flood Tide |
|
|
C1 |
IM1, IM2, IM3, IM4, IM5, IM6, IM7, IM8, SR3 |
|
SR2(1) |
IM7, IM8, IM9, IM10, IM11, IM12, SR1A, SR3, SR4A, SR5A, SR6, SR8 |
|
Ebb Tide |
|
|
C1 |
SR4A, SR5A, SR6 |
|
C2 |
IM1, IM2, IM3, IM4, IM5, IM6, IM7, IM8, IM9, IM10, IM11, IM12, SR1A, SR2, SR3, SR7, SR8 |
Note:
(1) As per findings of Baseline Water Quality Monitoring Report, the control reference has been changed from C3 to SR2 from 1 Sep 2016 onwards.
4.2
Monitoring Equipment
Table 4.4 summarises the equipment used in the reporting period for monitoring of specific water quality parameters under the water quality monitoring programme.
Table 4.4: Water Quality Monitoring Equipment
|
Brand and Model |
Last Calibration Date |
Calibration Certificate Provided in |
|
|
Multifunctional Meter (measurement of DO, pH, temperature, salinity and turbidity) |
YSI ProDSS (Serial No. 00019CB2) |
27 Mar 2019 (1) |
Monthly EM&A Report No. 39, Appendix D |
|
YSI ProDSS (Serial No. 17H105557) |
30 Apr 2019 |
Monthly EM&A Report No. 41, Appendix D |
|
|
YSI ProDSS (Serial No. 16H104233) |
30 Apr 2019 |
||
|
YSI ProDSS (Serial No. 16H104234) |
30 Apr 2019 |
||
|
YSI ProDSS (Serial No. 17E100747) |
25 Jun 2019 |
||
|
YSI ProDSS (Serial No. 15M100005) |
25 Jun 2019 |
||
|
Digital Titrator (measurement of total alkalinity) |
Titrette Digital Burette 50ml Class A (Serial No. 10N65665) |
20 May 2019 |
Monthly EM&A Report No. 41, Appendix D |
|
Note: (1) The monitoring equipment was not used in the reporting period after the expiry date of the calibration certificate. |
|||
Other equipment used as part of the impact water quality monitoring programme are listed in Table 4.5.
Table 4.5: Other Monitoring Equipment
|
Equipment |
Brand and Model |
|
Water Sampler |
Van Dorn Water Sampler |
|
Positioning Device (measurement of GPS) |
Garmin eTrex Vista HCx |
|
Current Meter (measurement of current speed and direction, and water depth) |
Sontek HydroSurveyor |
4.3
Monitoring
Methodology
4.3.1
Measuring Procedure
Water quality monitoring samples were taken at three depths (at 1m below surface, at mid-depth, and at 1m above bottom) for locations with water depth >6m. For locations with water depth between 3m and 6m, water samples were taken at two depths (surface and bottom). For locations with water depth <3m, only the mid-depth was taken. Duplicate water samples were taken and analysed.
The water samples for all monitoring parameters were collected, stored, preserved and analysed according to the Standard Methods, APHA 22nd ed. and/or other methods as agreed by the EPD. In-situ measurements at monitoring locations including temperature, pH, DO, turbidity, salinity, alkalinity and water depth were collected by equipment listed in Table 4.4 and Table 4.5. Water samples for heavy metals and SS analysis were stored in high density polythene bottles with no preservative added, packed in ice (cooled to 4 ºC without being frozen), delivered to the laboratory within 24 hours of collection.
4.3.2
Maintenance and Calibration
Calibration of In-situ Instruments
Wet bulb calibration for a DO meter was carried out before commencement of monitoring and after completion of all measurements each day. Calibration was not conducted at each monitoring location as daily calibration is adequate for the type of DO meter employed. A zero check in distilled water was performed with the turbidity probe at least once per monitoring day. The probe was then calibrated with a solution of known NTU. In addition, the turbidity probe was calibrated at least twice per month to establish the relationship between turbidity readings (in NTU) and levels of SS (in mg/L). Accuracy check of the digital titrator was performed at least once per monitoring day.
Calibration certificates of the monitoring equipment used in the reporting period listed in Table 4.4 are still valid.
4.3.3 Laboratory Measurement /
Analysis
Analysis of SS and heavy metals have been carried out by a HOKLAS accredited laboratory, ALS Technichem (HK) Pty Ltd (Reg. No. HOKLAS 066). Sufficient water samples were collected at all the monitoring stations for carrying out the laboratory SS and heavy metals determination. The SS and heavy metals determination works were started within 24 hours after collection of the water samples. The analysis of SS and heavy metals have followed the standard methods summarised in Table 4.6. The QA/QC procedures for laboratory measurement/ analysis of SS and heavy metals were presented in Appendix F of the Construction Phase Monthly EM&A Report No.8.
Table 4.6: Laboratory Measurement/ Analysis of SS and Heavy Metals
|
Parameters |
Instrumentation |
Analytical Method |
Reporting Limit |
|
SS |
Analytical Balance |
APHA 2540D |
2 mg/L |
|
Heavy Metals |
|
|
|
|
Chromium (Cr) |
ICP-MS |
USEPA 6020A |
0.2 µg/L |
|
Nickel (Ni) |
ICP-MS |
USEPA 6020A |
0.2 µg/L |
4.4
Summary of Monitoring Results
The water quality monitoring schedule for the reporting period is updated and provided in Appendix C. Due to adverse weather and thunderstorm warning in force, the general water quality monitoring and regular DCM monitoring session during mid-ebb tide on 13 June 2019 was cancelled.
The water quality monitoring results for turbidity, SS, total alkalinity, and chromium obtained during the reporting period were within their corresponding Action and Limit Level. The detailed monitoring results are presented in Appendix D.
For DO and nickel, some of the testing results triggered the corresponding Action or Limit Levels, and investigations were conducted accordingly.
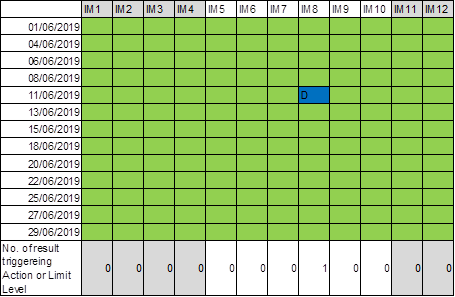
Table 4.7 to Table 4.10 present summaries of the DO compliance status at IM and SR stations during mid-ebb and mid-flood tide for the reporting period.
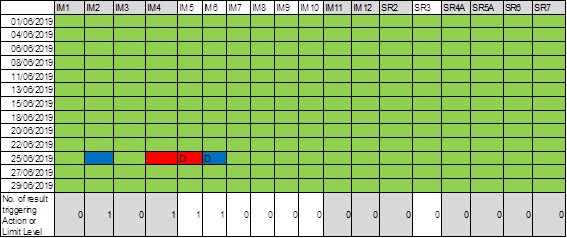
Table 4.7: Summary of DO (Surface and Middle) Compliance Status (Mid-Ebb Tide)
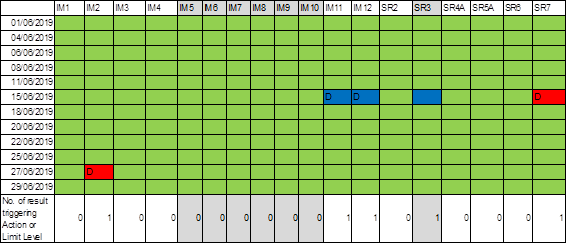
Table 4.8: Summary of DO (Bottom) Compliance Status (Mid-Ebb Tide)
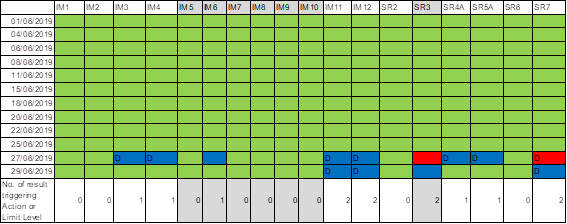
Table 4.9: Summary of DO (Surface and Middle) Compliance Status (Mid-Flood Tide)
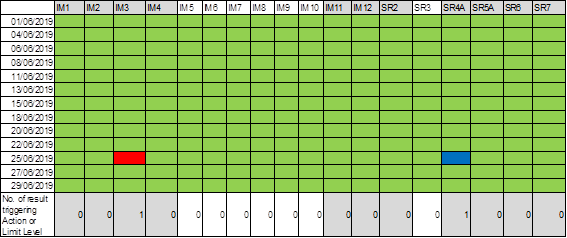
Table 4.10: Summary of DO (Bottom) Compliance Status (Mid-Flood Tide)
|
Note: Detailed results are presented in Appendix D. |
|
|
Legend: |
|
|
|
The monitoring results were within the corresponding Action and Limit Levels |
|
|
Monitoring result triggered the Action Level at monitoring station located upstream of the Project based on dominant tidal flow |
|
D |
Monitoring result triggered the Action Level at monitoring station located downstream of the Project based on dominant tidal flow |
|
|
Monitoring result triggered the Limit Level at monitoring station located upstream of the Project based on dominant tidal flow |
|
D |
Monitoring result triggered the Limit Level at monitoring station located downstream of the Project based on dominant tidal flow |
|
|
Upstream station with respect to the Project during the respective tide based on dominant tidal flow |
Monitoring results triggered the corresponding Action and Limit Levels on four monitoring days. Repeat measurement were conducted on 16, 25, 28, and 30 June 2019 respectively according to the Manual. Some cases occurred at monitoring stations upstream of the Project during respective tide and would unlikely be affected by the Project. Investigation was therefore focused on cases that occurred at monitoring station located downstream of the Project. Details of the Project’s marine construction activities and site observations on the concerned monitoring days were collected. The findings are summarized in Table 4.11.
Table 4.11: Summary of Findings from Investigation of DO Monitoring Results
|
Date |
Marine construction works nearby |
Approximate distance from marine construction works
|
Status of water quality measures (if applicable) |
Construction vessels in the vicinity |
Turbidity / Silt plume observed near the monitoring station |
Action or Limit Level triggered due to Project |
|
15/06/2019 |
Marine filling and DCM works |
Around 2 km |
Localised and enhanced silt curtain deployed |
No |
No |
No |
|
25/06/2019 |
Marine filling and DCM works |
Around 500m |
Localised and enhanced silt curtain deployed |
No |
No |
No |
|
27/06/2019 |
Marine filling and DCM works |
Around 500m |
Localised and enhanced silt curtain deployed |
No |
No |
No |
|
29/06/2019 |
Marine filling and DCM works |
Around 2 km |
Localised and enhanced silt curtain deployed |
No |
No |
No |
The investigation confirmed that marine filling and DCM works were operating normally with localised and enhanced silt curtain deployed. The localised and enhanced silt curtains were maintained properly and checked by ET regularly.
On 15 June 2019, it was noted that the DO concentration recorded at control station C2 was lower than that at the downstream impact and sensitive receiver stations IM11, IM12, and SR7. This suggested the presence of external sources that may affect DO concentrations around the Project area.
On 25 June 2019, it was found that DO exceedances were also recorded at upstream impact stations IM2, IM3, and IM4, which were unlikely to be affected by Project activities. IM5 and IM6 were located downstream of these stations and were potentially influenced by these external sources. With no silt plume observed at the monitoring stations and mitigation measures implemented properly, the cases recorded at these impact stations were considered not caused by the Project.
On 27 and 29 June 2019, it was found that the DO concentration at some of the impact and sensitive receiver stations (namely IM3, IM4, IM11, IM12, SR5A, and SR7) were higher than that recorded at their respective control station C1 or C2. The DO concentration at IM2, IM3, IM4, SR4A, and SR7 were also within their corresponding baseline ranges during baseline monitoring of the Project. With no silt plume observed at the monitoring stations and mitigation measures implemented properly, the cases recorded at these impact and sensitive receiver stations were considered not caused by the Project.
Table 4.12 presents a summary of the Nickel compliance status at IM stations during mid-ebb tide for the reporting period
Table 4.12: Summary of Nickel Compliance Status (Mid-Ebb Tide)
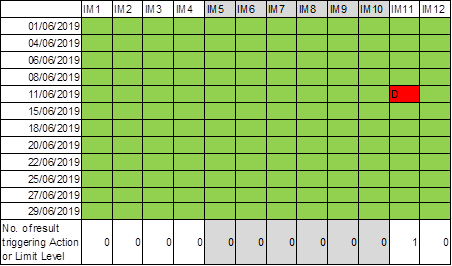
Table 4.13 presents a summary of the Nickel compliance status at IM stations during mid-flood tide for the reporting period
Table 4.13: Summary of Nickel Compliance Status (Mid-Flood Tide)
|
Note: Detailed results are presented in Appendix D. |
|
|
Legend: |
|
|
|
The monitoring results were within the corresponding Action and Limit Levels |
|
D |
Monitoring result triggered the Action Level at monitoring station located downstream of the Project based on dominant tidal flow |
|
D |
Monitoring result triggered the Limit Level at monitoring station located downstream of the Project based on dominant tidal flow |
|
|
Upstream station with respect to the Project during the respective tide based on dominant tidal flow |
Nickel monitoring results triggered the corresponding Action and Limit Level on 11 June 2019. Details of the Project’s marine construction activities on the concerned monitoring day was collected and findings are summarized in Table 4.14.
Table 4.14: Summary of Findings from Investigation of Nickel Monitoring Results
|
Date |
Marine construction works nearby |
Approximate distance between nearest marine construction works and concerned monitoring stations
|
Status of water quality measures (if applicable) |
Construction vessels in the vicinity |
Turbidity / Silt plume observed near the monitoring station |
Action or Limit Level triggered due to Project |
|
11/6/2019 |
Marine filling and DCM works |
Around 1 km |
Localised and enhanced silt curtain deployed |
No |
No |
No |
The investigation confirmed that marine filling and DCM works were operating normally with localised and enhanced silt curtain deployed. The localised and enhanced silt curtains were maintained properly and checked by ET regularly.
Nickel is a representative heavy metal that indicates the potential for release of contaminants from contaminated mud pits due to the disturbance of marine sediment within it by DCM activities. Elevated nickel concentration due to these activities should be associated with similar elevated SS levels. The SS results at IM8 and IM11 were within the Action and Limit Levels and they were located 1.5km and 2km away from the closest active DCM barge respectively. These indicate that active DCM works had limited influence on water quality when monitoring were conducted at these monitoring stations. The nickel concentration recorded at IM8 was also within the baseline range during baseline monitoring of the Project. Considering that no silt plume was observed at the monitoring stations and mitigation measures were implemented properly, the cases recorded at these impact stations were considered not caused by the Project.
4.5
Conclusion
During the reporting period, it is noted that the vast majority of monitoring results were within their corresponding Action and Limit Levels, while only a minor number of results triggered the corresponding Action and Limit Levels, and investigations were conducted accordingly.
Based on the investigation findings, all results that triggered the corresponding Action or Limit Levels were not due to the Project. Therefore, the Project did not cause adverse impact at the water quality sensitive receivers. All required actions under the Event and Action Plan were followed. These cases appeared to be due to natural fluctuation or other sources not related to the Project.
Nevertheless, as part of the EM&A programme, the construction methods and mitigation measures for water quality will continue to be monitored and opportunities for further enhancement will continue to be explored and implemented where possible, to strive for better protection of water quality and the marine environment.
In the meantime, the contractors were reminded to implement and maintain all mitigation measures during weekly site inspection and regular environmental management meetings. These include maintaining mitigation measures properly for reclamation works including DCM works, marine filling, and seawall construction as recommended in the Manual.
5
Waste Management
In accordance with the Manual, the waste generated from construction activities was audited once per week to determine if wastes are being managed in accordance with the Waste Management Plan (WMP) prepared for the Project, contract-specific WMP, and any statutory and contractual requirements. All aspects of waste management including waste generation, storage, transportation and disposal were assessed during the audits.
5.1
Action and Limit Levels
The Action and Limit Levels of the construction waste are provided in Table 5.1.
Table 5.1: Action and Limit Levels for Construction Waste
|
Monitoring Stations |
Action Level |
Limit Level |
|
Construction Area |
When one valid documented complaint is received |
Non-compliance of the WMP, contract-specific WMPs, any statutory and contractual requirements |
5.2
Waste Management Status
Weekly monitoring on all works contracts were carried out by the ET to check and monitor the implementation of proper waste management practices during the construction phase.
Recommendations made included provision and maintenance of proper chemical waste storage area, as well as handling, segregation, and regular disposal of general refuse. The contractors had taken actions to implement the recommended measures.
Based on updated information provided by contractors, construction waste generated in the reporting period is summarized in Table 5.2.
There were no complaints, non-compliance of the WMP, contract-specific WMPs, statutory and contractual requirements that triggered Action and Limit Levels in the reporting period.
Table 5.2: Construction Waste Statistics
|
|
C&D(1) Material Stockpiled for Reuse or Recycle (m3) |
C&D Material Reused in the Project (m3) |
C&D Material Reused in other Projects (m3) |
C&D Material Transferred to Public Fill (m3) |
Chemical Waste (kg) |
Chemical Waste (L) |
General Refuse (tonne) |
|
|||||||||
|
|
May 2019(2)(3) |
13,616 |
*10,284 |
0 |
5,617 |
230 |
18,000 |
242 |
|||||||||
|
|
June 2019(3) |
9,690 |
4,166 |
0 |
5,570 |
150 |
15,400 |
354 |
|||||||||
|
|
|
Notes: (1) C&D refers to Construction and Demolition. (2) Updated figures in the past month are reported and marked with an asterisk (*). Updated figures for earlier months will be reported in the forthcoming Annual EM&A Report. (3) Metals, paper and/or plastics were recycled in the reporting period. |
|||||||||||||||
6
Chinese White Dolphin Monitoring
In accordance with the Manual, CWD monitoring by small vessel line-transect survey supplemented by land-based theodolite tracking survey and passive acoustic monitoring should be conducted during construction phase.
The small vessel line-transect survey should be conducted at a frequency of two full surveys per month, while land-based theodolite tracking survey should be conducted at a frequency of one day per month per station at Sha Chau (SC) and Lung Kwu Chau (LKC) during the construction phase as stipulated in the Manual. Supplemental theodolite tracking survey of one additional day has also been conducted at LKC, i.e. in total twice per month at the LKC station.
6.1
Action and Limit Levels
The Action and Limit Levels for CWD monitoring were formulated by the action response approach using the running quarterly dolphin encounter rates STG and ANI derived from the baseline monitoring data, as presented in the CWD Baseline Monitoring Report. The derived values of Action and Limit Levels for CWD monitoring were summarized in Table 6.1.
Table 6.1: Derived Values of Action and Limit Levels for Chinese White Dolphin Monitoring
|
|
NEL, NWL, AW, WL and SWL as a Whole |
|
Action Level(3) |
Running quarterly(1) STG < 1.86 & ANI < 9.35 |
|
Limit Level(3) |
Two consecutive running quarterly(2) (3-month) STG < 1.86 & ANI < 9.35 |
|
Notes: (referring to the baseline monitoring report) (1) Action Level – running quarterly STG & ANI will be calculated from the three preceding survey months. (2) Limit Level – two consecutive running quarters mean both the running quarterly encounter rates of the preceding month and the running quarterly encounter rates of this month. (3) Action Level and/or Limit Level will be triggered if both STG and ANI fall below the criteria. |
|
6.2
CWD
Monitoring Transects and Stations
6.2.1
Small Vessel Line-transect Survey
Small vessel line-transect surveys were conducted along the transects covering Northeast Lantau (NEL), Northwest Lantau (NWL), Airport West (AW), West Lantau (WL) and Southwest Lantau (SWL) areas as proposed in the Manual, which are consistent with the Agriculture, Fisheries and Conservation Department (AFCD) long-term monitoring programme (except the addition of AW). The AW transect has not been previously surveyed in the AFCD programme due to the restrictions of HKIA Approach Area, nevertheless, this transect was established during the EIA of the 3RS Project and refined in the Manual with the aim to collect project specific baseline information within the HKIA Approach Area to fill the data gap that was not covered by the AFCD programme. This also provided a larger sample size for estimating the density, abundance and patterns of movements in the broader study area of the project.
The planned vessel survey transect lines follow the waypoints set for construction phase monitoring as proposed in the Manual and depicted in Figure 6.1 with the waypoint coordinates of all transect lines given in Table 6.2, which are subject to on-site refinement based on the actual survey conditions and constraints.
Table 6.2: Coordinates of Transect Lines in NEL, NWL, AW, WL and SWL Survey Areas
|
Waypoint |
Easting |
Northing |
Waypoint |
Easting |
Northing |
|
NEL |
|||||
|
1S |
813525 |
820900 |
6N |
818568 |
824433 |
|
1N |
813525 |
824657 |
7S |
819532 |
821420 |
|
2S |
814556 |
818449 |
7N |
819532 |
824209 |
|
2N |
814559 |
824768 |
8S |
820451 |
822125 |
|
3S |
815542 |
818807 |
8N |
820451 |
823671 |
|
3N |
815542 |
824882 |
9S |
821504 |
822371 |
|
4S |
816506 |
819480 |
9N |
821504 |
823761 |
|
4N |
816506 |
824859 |
10S |
822513 |
823268 |
|
5S |
817537 |
820220 |
10N |
822513 |
824321 |
|
5N |
817537 |
824613 |
11S |
823477 |
823402 |
|
6S |
818568 |
820735 |
11N |
823477 |
824613 |
|
NWL |
|||||
|
1S |
804671 |
814577 |
5S |
808504 |
821735 |
|
1N |
804671 |
831404 |
5N |
808504 |
828602 |
|
2Sb |
805475 |
815457 |
6S |
809490 |
822075 |
|
2Nb |
805476 |
818571 |
6N |
809490 |
825352 |
|
2Sa |
805476 |
820770 |
7S |
810499 |
822323 |
|
2Na |
805476 |
830562 |
7N |
810499 |
824613 |
|
3S |
806464 |
821033 |
8S |
811508 |
821839 |
|
3N |
806464 |
829598 |
8N |
811508 |
824254 |
|
4S |
807518 |
821395 |
9S |
812516 |
821356 |
|
4N |
807518 |
829230 |
9N |
812516 |
824254 |
|
AW |
|||||
|
1W |
804733 |
818205 |
2W |
805045 |
816912 |
|
1E |
806708 |
818017 |
2E |
805960 |
816633 |
|
WL |
|||||
|
1W |
800600 |
805450 |
7W |
800400 |
811450 |
|
1E |
801760 |
805450 |
7E |
802400 |
811450 |
|
2W |
800300 |
806450 |
8W |
800800 |
812450 |
|
2E |
801750 |
806450 |
8E |
802900 |
812450 |
|
3W |
799600 |
807450 |
9W |
801500 |
813550 |
|
3E |
801500 |
807450 |
9E |
803120 |
813550 |
|
4W |
799400 |
808450 |
10W |
801880 |
814500 |
|
4E |
801430 |
808450 |
10E |
803700 |
814500 |
|
5W |
799500 |
809450 |
11W |
802860 |
815500 |
|
5E |
801300 |
809450 |
12S/11E |
803750 |
815500 |
|
6W |
799800 |
810450 |
12N |
803750 |
818500 |
|
6E |
801400 |
810450 |
|
|
|
|
SWL |
|||||
|
1S |
802494 |
803961 |
6S |
807467 |
801137 |
|
1N |
802494 |
806174 |
6N |
807467 |
808458 |
|
2S |
803489 |
803280 |
7S |
808553 |
800329 |
|
2N |
803489 |
806720 |
7N |
808553 |
807377 |
|
3S |
804484 |
802509 |
8S |
809547 |
800338 |
|
3N |
804484 |
807048 |
8N |
809547 |
807396 |
|
4S |
805478 |
802105 |
9S |
810542 |
800423 |
|
4N |
805478 |
807556 |
9N |
810542 |
807462 |
|
5S |
806473 |
801250 |
10S |
811446 |
801335 |
|
5N |
806473 |
808458 |
10N |
811446 |
809436 |
6.2.2
Land-based Theodolite Tracking Survey
Land-based theodolite tracking survey stations were set up at two locations, one facing east/south/west on the southern slopes of Sha Chau (SC), and the other facing north/northeast/northwest at Lung Kwu Chau (LKC). The stations (D and E) are depicted in Figure 6.2 and shown in Table 6.3 with position coordinates, height of station and approximate distance of consistent theodolite tracking capabilities for CWD.
Table 6.3: Land-based Theodolite Survey Station Details
|
Stations |
Location |
Geographical Coordinates |
Station Height (m) |
Approximate Tracking Distance (km) |
|
D |
Sha Chau (SC) |
22° 20’ 43.5” N 113° 53’ 24.66” E |
45.66 |
2 |
|
E |
Lung Kwu Chau (LKC) |
22° 22’ 44.83” N 113° 53’ 0.2” E |
70.40 |
3 |
6.3
CWD
Monitoring Methodology
6.3.1
Small Vessel Line-transect Survey
Small vessel line-transect surveys provided data for density and abundance estimation and other assessments using distance-sampling methodologies, specifically, line-transect methods.
The surveys involved small vessel line-transect data collection and have been designed to be similar to, and consistent with, previous surveys for the AFCD for their long-term monitoring of small cetaceans in Hong Kong. The survey was designed to provide systematic, quantitative measurements of density, abundance and habitat use.
As mentioned in Section 6.2.1, the transects covered NEL, NWL covering the AW, WL and SWL areas as proposed in the Manual and are consistent with the AFCD long-term monitoring programme (except AW). There are two types of transect lines:
● Primary transect lines: the parallel and zigzag transect lines as shown in Figure 6.1; and
● Secondary transect lines: transect lines connecting between the primary transect lines and going around islands.
All data collected on both primary and secondary transect lines were used for analysis of sighting distribution, group size, activities including association with fishing boat, and mother-calf pairs. Only on-effort data collected under conditions of Beaufort 0-3 and visibility of approximately 1200 m or beyond were used for analysis of the CWD encounter rates.
A 15-20 m vessel with a flying bridge observation platform about 4 to 5 m above water level and unobstructed forward view, and a team of three to four observers were deployed to undertake the surveys. Two observers were on search effort at all times when following the transect lines with a constant speed of 7 to 8 knots (i.e. 13 to 15 km per hour), one using 7X handheld binoculars and the other using unaided eyes and recording data.
During on-effort survey periods, the survey team recorded effort data including time, position (waypoints), weather conditions (Beaufort sea state and visibility) and distance travelled in each series with assistance of a handheld GPS device. The GPS device also continuously and automatically logged data including time, position (latitude and longitude) and vessel speed throughout the entire survey.
When CWDs were seen, the survey team was taken off-effort, the dolphins were approached and photographed for photo-ID information (using a Canon 7D [or similar] camera and long 300 mm+ telephoto lens), then followed until they were lost from view. At that point, the boat returned (off effort) to the survey line at the closest point after obtaining photo records of the dolphin group and began to survey on effort again.
Focal follows of dolphins would be used for providing supplementary information only where practicable (i.e. when individual dolphins or small stable groups of dolphins with at least one member that could be readily identifiable with unaided eyes during observations and weather conditions are favourable). These would involve the boat following (at an appropriate distance to minimize disturbance) an identifiable individual dolphin for an extended period of time, and collecting detailed data on its location, behaviour, response to vessels, and associates.
6.3.2
Photo Identification
CWDs can be identified by their unique features like presence of scratches, nick marks, cuts, wounds, deformities of their dorsal fin and distinguished colouration and spotting patterns.
When CWDs were observed, the survey team was taken off-effort, the dolphins were approached and photographed for photo-ID information (using a Canon 7D [or similar] camera and long 300 mm+ telephoto lens). The survey team attempted to photo both sides of every single dolphin in the group as the colouration and spotting pattern on both sides may not be identical. The photos were taken at the highest available resolution and stored on Compact Flash memory cards for transferring into a computer.
All photos taken were initially examined to sort out those containing potentially identifiable individuals. These sorted-out images would then be examined in detail and compared to the CWD photo-identification catalogue established for 3RS during the baseline monitoring stage.
6.3.3
Land-based Theodolite Tracking Survey
Land-based theodolite tracking survey obtains fine-scale information on the time of day and movement patterns of the CWDs. A digital theodolite (Sokkia/Sokkisha Model DT5 or similar equipment) with 30-power magnification and 5-s precision was used to obtain the vertical and horizontal angle of each dolphin and vessel position. Angles were converted to geographic coordinates (latitude and longitude) and data were recorded using Pythagoras software, Version 1.2. This method delivers precise positions of multiple spatially distant targets in a short period of time. The technique is fully non-invasive, and allows for time and cost-effective descriptions of dolphin habitat use patterns at all times of daylight.
Three surveyors (one theodolite operator, one computer operator, and one observer) were involved in each survey. Observers searched for dolphins using unaided eyes and handheld binoculars (7X50). Theodolite tracking sessions were initiated whenever an individual CWD or group of CWDs was located. Where possible, a distinguishable individual was selected, based on colouration, within the group. The focal individual was then continuously tracked via the theodolite, with a position recorded each time the dolphin surfaced. In case an individual could not be positively distinguished from other members, the group was tracked by recording positions based on a central point within the group whenever the CWD surfaced. Tracking continued until animals were lost from view; moved beyond the range of reliable visibility (>1-3 km, depending on station height); or environmental conditions obstructed visibility (e.g., intense haze, Beaufort sea state >4, or sunset), at which time the research effort was terminated. In addition to the tracking of CWD, all vessels that moved within 2-3 km of the station were tracked, with effort made to obtain at least two positions for each vessel.
Theodolite tracking included focal follows of CWD groups and vessels. Priority was given to tracking individual or groups of CWD. The survey team also attempted to track all vessels moving within 1 km of the focal CWD.
6.4
Monitoring
Results and Observations
6.4.1
Small Vessel Line-transect Survey
Within this reporting period, two complete sets of small vessel line-transect surveys were conducted on the 4, 6, 11, 17, 18, 19, 26 and 27 June 2019, covering all transects in NEL, NWL, AW, WL and SWL survey areas for twice.
A total of around 457.38 km of survey effort was collected from these surveys, with around 86.9% of the total survey effort being conducted under favourable weather condition (i.e. Beaufort Sea State 3 or below with favourable visibility). Details of the survey effort are given in Appendix D.
Sighting Distribution
In June 2019, 12 sightings with 40 dolphins were sighted. Details of cetacean sightings are presented in Appendix D.
Distribution of all CWD sightings recorded in
June 2019 is illustrated in Figure 6.3. In NWL, CWD sightings were
recorded near Black Point and at the northern waters of Lung Kwu Chau
respectively. In WL, CWD sightings were recorded from Tai O to Peaked Hill. In
SWL, CWD sightings was scattered from the coastal water near Fan Lau to the coastal
water near Lo Kei Wan. No sightings of CWD were recorded in NEL or in close
vicinity to 3RS Works Area.
Figure 6.3: Sightings Distribution of Chinese White
Dolphins
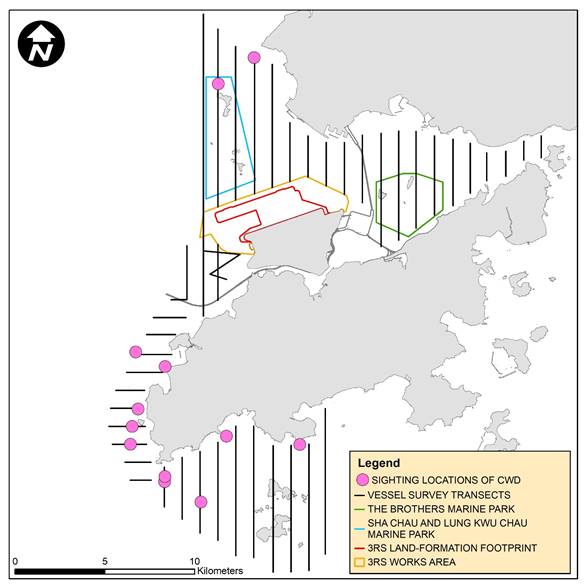
Encounter Rate
Two types of dolphin encounter rates were calculated based on the data from June 2019. They included the number of dolphin sightings per 100 km survey effort (STG) and total number of dolphins per 100 km survey effort (ANI) in the whole survey area (i.e. NEL, NWL, AW, WL and SWL). In the calculation of dolphin encounter rates, only survey data collected under favourable weather condition (i.e. Beaufort Sea State 3 or below with favourable visibility) were used. The formulae used for calculation of the encounter rates are shown below:
Encounter
Rate by Number of Dolphin Sightings (STG)
![]()
Encounter
Rate by Number of Dolphins (ANI)
![]()
(Notes: Only data collected under Beaufort 3 or below condition were used)
In June 2019, a total of around 397.40 km of survey effort were conducted under Beaufort Sea State 3 or below with favourable visibility, whilst a total number of 12 on-effort sightings with 40 dolphins were sighted under such condition. Calculation of the encounter rates in June 2019 are shown in Appendix D.
For the running quarter of the reporting period (i.e., from April 2019 to June 2019), a total of around 1281.10 km of survey effort were conducted under Beaufort Sea State 3 or below with favourable visibility, whilst a total number of 35 on-effort sightings and a total number of 135 dolphins from on-effort sightings were obtained under such condition. Calculation of the running quarterly encounter rates are shown in Appendix D.
The STG and ANI of CWD in the whole survey area (i.e. NEL, NWL, AW, WL and SWL) during the month of June 2019 and during the running quarter are presented in Table 6.4 below and compared with the Action Level. The running quarterly encounter rates STG and ANI did not trigger Action Level.
Table 6.4: Comparison of CWD Encounter Rates of the Whole Survey Area with Action Levels
|
|
Encounter Rate (STG) |
Encounter Rate (ANI) |
|
June 2019 |
3.02 |
10.07 |
|
Running Quarter from April 2019 to June 2019(1) |
2.73 |
10.54 |
|
Action Level |
Running quarterly(1) STG < 1.86 & ANI < 9.35 |
|
|
Note: (1) Running quarterly encounter rates STG & ANI were calculated from data collected in the reporting period and the two preceding survey months, i.e. the data from April 2019 to June 2019, containing six sets of transect surveys for all monitoring areas. Action Level will be triggered if both STG and ANI fall below the criteria. |
||
Group Size
In June 2019, 12 groups with 40 dolphins were sighted, and the average group size of CWDs was 3.3 dolphins per group. The number of sightings with medium group size (i.e. 3.-9 dolphins) is slightly higher than that with small group size (i.e. 1-2 dolphins). No CWD sightings with large group size (i.e. 10 or more dolphins) were recorded in June 2019.
Activities and Association with Fishing Boats
Six sightings of CWDs were recorded engaging in feeding activities in June 2019 in NWL, WL and SWL survey areas. One CWD sighting was observed in association with operating purse seiner in SWL.
Mother-calf Pair
In June 2019, there were three sightings of CWD with the presence of mother-and-unspotted juvenile pair.
6.4.2
Photo Identification
In June 2019, a total number of 20 different CWD individuals were identified for totally 21 times. A summary of photo identification works is presented in Table 6.5. Representative photos of these individuals are given in Appendix D.
Table 6.5: Summary of Photo Identification
|
Individual ID |
Date of Sighting (dd-mmm-yy) |
Sighting Group No. |
Area |
|
Individual ID |
Date of Sighting (dd-mmm-yy) |
Sighting Group No. |
Area |
|
NLMM019 |
19-Jun-19 |
1 |
NWL |
|
WLMM043 |
6-Jun-19 |
2 |
WL |
|
NLMM021 |
19-Jun-19 |
1 |
NWL |
|
|
26-Jun-19 |
1 |
WL |
|
NLMM027 |
19-Jun-19 |
1 |
NWL |
|
WLMM052 |
26-Jun-19 |
1 |
WL |
|
NLMM034 |
26-Jun-19 |
1 |
WL |
|
WLMM068 |
6-Jun-19 |
1 |
WL |
|
NLMM046 |
26-Jun-19 |
1 |
WL |
|
WLMM073 |
26-Jun-19 |
2 |
WL |
|
NLMM070 |
26-Jun-19 |
1 |
WL |
|
WLMM078 |
18-Jun-19 |
2 |
SWL |
|
SLMM011 |
18-Jun-19 |
2 |
SWL |
|
WLMM079 |
18-Jun-19 |
3 |
SWL |
|
SLMM025 |
26-Jun-19 |
2 |
WL |
|
WLMM083 |
6-Jun-19 |
2 |
WL |
|
SLMM028 |
18-Jun-19 |
1 |
SWL |
|
WLMM122 |
26-Jun-19 |
1 |
WL |
|
WLMM027 |
18-Jun-19 |
2 |
SWL |
|
WLMM131 |
6-Jun-19 |
3 |
WL |
|
|
|
|
|
|
WLMM138 |
6-Jun-19 |
2 |
WL |
6.4.3
Land-based Theodolite Tracking Survey
Survey Effort
Land-based theodolite tracking surveys were conducted at LKC on 5 and 21 June 2019 and at SC on 18 June 2019, with a total of three days of land-based theodolite tracking survey effort accomplished in this reporting period. Three CWD groups were tracked at LKC station during the surveys. Information of survey effort and CWD groups sighted during these land-based theodolite tracking surveys are presented in Table 6.6. Details of the survey effort and CWD groups tracked are presented in Appendix D. The first sighting locations of CWD groups tracked at LKC station during land-based theodolite tracking surveys in June 2019 were depicted in Figure 6.4. No CWD group was sighted from SC station in this reporting month.
Table 6.6: Summary of Survey Effort and CWD Group of Land-based Theodolite Tracking
|
Land-based Station |
|
No. of Survey Sessions |
Survey Effort (hh:mm) |
No. of CWD Groups Sighted |
CWD Group Sighting per Survey Hour |
|
Lung Kwu Chau |
|
2 |
12:00 |
3 |
0.25 |
|
Sha Chau |
|
1 |
6:00 |
0 |
0 |
|
TOTAL |
|
3 |
18:00 |
3 |
0.17 |
Figure 6.4: Plots of First Sightings of All CWD Groups obtained from Land-based Stations
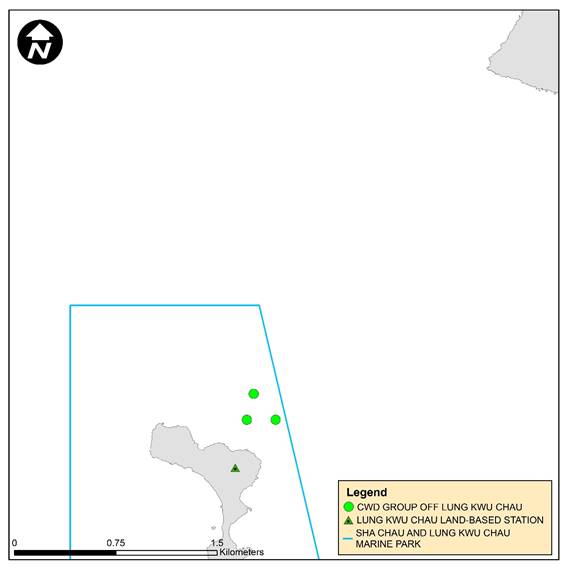
6.5
Progress Update on Passive Acoustic Monitoring
Underwater acoustic monitoring using Passive Acoustic Monitoring (PAM) should be undertaken during land formation related construction works. In this reporting period, the Ecological Acoustic Recorder (EAR) was remained underwater and positioned at south of Sha Chau Island inside the SCLKCMP with 20% duty cycle (Figure 6.5). The EAR deployment is generally for 6 weeks prior to data retrieval for analysis. Acoustic data is reviewed to give an indication of CWDs occurrence patterns and to obtain anthropogenic noise information simultaneously. Analysis (by a specialized team of acousticians) involved manually browsing through every acoustic recording and logging the occurrence of dolphin signals. All data will be re-played by computer as well as listened to by human ears for accurate assessment of dolphin group presence. As the period of data collection and analysis takes more than four months, PAM results could not be reported in monthly intervals but report for supplementing the annual CWD monitoring analysis.
6.6
Site Audit for CWD-related Mitigation Measures
During the reporting period, silt curtains were in place by the contractor for marine filling, in which dolphin observers were deployed by contractor in accordance with the MMWP. Overall, 4 to 14 dolphin observation stations and teams of at least two dolphin observers were deployed by the contractors for continuous monitoring of the DEZ for DCM works, PVD installation, and seawall construction in accordance with the DEZ Plan. Trainings for the proposed dolphin observers on the implementation of MMWP and DEZ monitoring were provided by the ET prior to the aforementioned works, with a cumulative total of 677 individuals being trained and the training records kept by the ET. From the contractors’ MMWP observation records, no dolphin or other marine mammals were observed within or around the silt curtains. As for DEZ monitoring records, no dolphin or other marine mammals were observed within or around the DEZs in this reporting month. These contractors’ records were also audited by the ET during site inspection. Audits of acoustic decoupling measures for construction vessels were carried out during weekly site inspection and the observations are summarised in Section 7.1. Audits of SkyPier high speed ferries route diversion and speed control and construction vessel management are presented in Section 7.2 and Section 7.3 respectively.
6.7
Timing of
Reporting CWD Monitoring Results
Detailed analysis of CWD monitoring results collected by small vessel line-transect survey will be provided in future quarterly reports. Detailed analysis of CWD monitoring results collected by land-based theodolite tracking survey and PAM will be provided in future annual reports after a larger sample size of data has been collected.
6.8
Summary of CWD Monitoring
Monitoring of CWD was conducted with two complete sets of small vessel line-transect surveys and three days of land-based theodolite tracking survey effort as scheduled. The running quarterly encounter rates STG and ANI in the reporting period did not trigger the Action Level for CWD monitoring.
7
Environmental Site Inspection and Audit
7.1
Environmental Site Inspection
Site inspections of the construction works were carried out on a weekly basis to monitor the implementation of proper environmental pollution control and mitigation measures for the Project. The weekly site inspection schedule of the construction works is provided in Appendix C. Bi-weekly site inspections were also conducted by the IEC. Besides, ad-hoc site inspections were conducted by ET and IEC if environmental problems were identified, or subsequent to receipt of an environmental complaint, or as part of the investigation work. These site inspections provided a direct means to reinforce the specified environmental protection requirements and pollution control measures in construction sites.
During site inspections, environmental situation, status of implementation of pollution control and mitigation measures were observed. Environmental documents and site records, including waste disposal record, maintenance record of environmental equipment, and relevant environmental permit and licences, were also checked on site. Observations were recorded in the site inspection checklist and passed to the contractor together with the appropriate recommended mitigation measures where necessary in order to advise contractors on environmental improvement, awareness and on-site enhancement measures. The observations were made with reference to the following information during the site inspections:
· The EIA and EM&A requirements;
· Relevant environmental protection laws, guidelines, and practice notes;
· The EP conditions and other submissions under the EP;
· Monitoring results of EM&A programme;
· Works progress and programme;
· Proposal of individual works;
· Contract specifications on environmental protection; and
· Previous site inspection results.
Good site practices were observed in site inspections during the reporting period. Advice were given when necessary to ensure the construction workforce were familiar with relevant procedures, and to maintain good environmental performance on site. Regular toolbox talks on environmental issues were organized for the construction workforce by the contractors to ensure understanding and proper implementation of environmental protection and pollution control mitigation measures.
During the reporting period, implementation of recommended landscape and visual mitigation measures (CM1 – CM10) where applicable was monitored weekly in accordance with the Manual and no non-conformity was recorded. In case of non-conformity, specific recommendations will be made, and actions will be proposed according to the Event and Action Plan. The monitoring status is summarized in Appendix B.
A summary of implementation status of the environmental mitigation measures for the construction phase of the Project during the reporting period is provided in Appendix B.
7.2
Audit of SkyPier High Speed Ferries
The Marine Travel Routes and Management Plan for High Speed Ferries of SkyPier (the SkyPier Plan) was submitted to the Advisory Council on the Environment for comment and subsequently submitted to and approved by EPD in November 2015 under EP Condition 2.10. The approved SkyPier Plan is available on the dedicated website of the Project. In the SkyPier Plan, AAHK has committed to implement the mitigation measure of requiring HSFs of SkyPier travelling between HKIA and Zhuhai / Macau to start diverting the route with associated speed control across the area, i.e. Speed Control Zone (SCZ), with high CWD abundance. The route diversion and speed restriction at the SCZ have been implemented since 28 December 2015.
Key audit findings for the SkyPier HSFs travelling to/from Zhuhai and Macau against the requirements of the SkyPier Plan during the reporting period are summarized in Table 7.1. The daily movements of all SkyPier HSFs in this reporting period (i.e., 82 daily movements were within the maximum daily cap of 125 daily movements. Status of compliance with the annual daily average of 99 movements will be further reviewed in the annual EM&A Report.
In total, 630 ferry movements between HKIA SkyPier and Zhuhai / Macau were recorded in June 2019 and the data are presented in Appendix H. The time spent by the SkyPier HSFs travelling through the SCZ in June 2019 were presented in Figure 7.1. It will take 9.6 minutes to travel through the SCZ when the SkyPier HSFs adopt the maximum allowable speed of 15 knots within the SCZ. Figure 7.1 shows that all of the SkyPier HSFs spent more than 9.6 minutes to travel through the SCZ.
Figure 7.1: Duration of the SkyPier HSFs travelling through the SCZ for June 2019
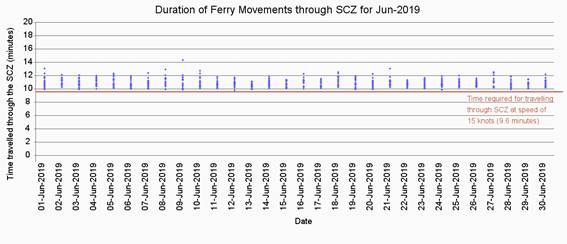
Note: Data above the red line indicated that the time spent by the SkyPier HSFs travelling through the SCZ is more than 9.6 minutes, which is in compliance with the SkyPier Plan.
A total of two ferries were recorded with minor route deviations on 10 and 17 June 2019. Notices were sent to the ferry operators and the cases are under investigation by ET.
As reported in the Construction Phase Monthly EM&A Report No. 41, two ferries were recorded with minor route deviation cases on 11 and 20 May 2019. ET’s investigation found that all the deviations were due to giving way to vessels in order to avoid collision.
Table 7.1: Summary of Key Audit Findings against the SkyPier Plan
|
Requirements in the SkyPier Plan |
1 to 30 June 2019 |
|
Total number of ferry movements recorded and audited |
630
|
|
Use diverted route and enter / leave SCZ through Gate Access Points |
2 deviations |
|
Speed control in speed control zone |
The average speeds of all HSFs travelling through the SCZ ranged from 9.5 to 13.9 knots. All HSFs had travelled through the SCZ with average speeds under 15 knots in compliance with the SkyPier Plan. The time used by HSFs to travel through SCZ is presented in Figure 7.1. |
|
Daily Cap (including all SkyPier HSFs)
|
82 daily movements (within the maximum daily cap - 125 daily movements). |
7.3
Audit of
Construction and Associated Vessels
ET carried out the following actions during the reporting period:
- Skipper
training sessions were held for contractors’ concerned
skippers of relevant construction vessels to familiarize them with the
predefined routes; general education on local cetaceans; guidelines for
avoiding adverse water quality impact; the required environmental practices
/ measures while operating construction and associated vessels under the
Project; and guidelines for operating vessels safely in the presence of
CWDs. The list of all trained skippers was properly recorded and
maintained by ET.
- Three
skipper training sessions were held by contractors’ Environmental
Officers. Competency tests were subsequently conducted with the trained
skippers by ET.
- In
this reporting period, no skippers were trained by ET and four skippers
were trained by contractors’ Environmental Officers. In total, 1155
skippers were trained from August 2016 to June 2019.
- The
Marine Surveillance System (MSS) automatically recorded deviation cases
such as speeding, entering no entry zone and not travelling through the
designated gate. ET conducted checking to ensure the MSS records deviation
cases accurately.
- Deviations
such as speeding in the works area, entered no entry zone, and entering
from non-designated gates were identified. All the concerned contractors
were reminded to comply with the requirements of the MTRMP-CAV during the
bi-weekly MTCC audit.
- Three-month
rolling programmes (one month record and three months forecast) for
construction vessel activities were received from the contractors in order
to help maintain the number of construction and associated vessels on site
to a practicable minimal level.
7.4
Implementation
of Dolphin Exclusion Zone
During the reporting period, ET was notified that no dolphin sightings were recorded within the DEZ by the contractors. The ET checked the relevant records by the contractors and conducted competence checking to audit the implementation of DEZ.
7.5
Status of
Submissions under Environmental Permits
The current status of submissions under the EP up to the reporting period is presented in Table 7.2.
Table 7.2: Status of Submissions under Environmental Permit
|
EP Condition |
Submission |
Status |
|
2.1 |
Complaint Management Plan |
Accepted / approved by EPD |
|
2.4 |
Management Organizations |
|
|
2.5 |
Construction Works Schedule and Location Plans |
|
|
2.7 |
Marine Park Proposal |
|
|
2.8 |
Marine Ecology Conservation Plan |
|
|
2.9 |
Marine Travel Routes and Management Plan for Construction and Associated Vessels |
|
|
2.10 |
Marine Travel Routes and Management Plan for High Speed Ferries of SkyPier |
|
|
2.11 |
Marine Mammal Watching Plan |
|
|
2.12 |
Coral Translocation Plan |
|
|
2.13 |
Fisheries Management Plan |
|
|
2.14 |
Egretry Survey Plan |
|
|
2.15 |
Silt Curtain Deployment Plan |
|
|
2.16 |
Spill Response Plan |
|
|
2.17 |
Detailed Plan on Deep Cement Mixing |
|
|
2.18 |
Landscape & Visual Plan |
Submitted to EPD |
|
2.19 |
Waste Management Plan |
Accepted / approved by EPD |
|
2.20 |
Supplementary Contamination Assessment Plan |
|
|
3.1 |
Updated EM&A Manual |
|
|
3.4 |
Baseline Monitoring Reports |
7.6
Compliance with
Other Statutory Environmental Requirements
During the reporting period, environmental related licenses and permits required for the construction activities were checked. No non-compliance with environmental statutory requirements was recorded. The environmental licenses and permits which are valid in the reporting period are presented in Appendix F.
7.7
Analysis and
Interpretation of Complaints, Notification of Summons and Status of
Prosecutions
7.7.1
Complaints
No construction activities-related complaint was received during the reporting period.
7.7.2
Notifications of Summons or Status of Prosecution
Neither notification of summons nor prosecution was received during the reporting period.
7.7.3 Cumulative Statistics
Cumulative statistics on complaints, notifications of summons and status of prosecutions are summarized in Appendix G.
8 Future Key Issues and Other EIA & EM&A Issues
8.1
Construction Programme for the Coming Reporting Period
Key activities anticipated in the next reporting period for the Project will include the following:
Contract P560 (R) Aviation Fuel Pipeline Diversion Works
● Stockpiling of compressed materials
DCM Works:
Contract 3201 and 3205 DCM Works
● DCM works
Reclamation Works:
Contract 3206 Main Reclamation Works
● Land base ground improvement works;
● Seawall construction; and
● Marine filling.
Airfield Works:
Contract 3301 North Runway Crossover Taxiway
● Cable ducting works;
● Subgrade compaction and paving works;
● Drainage construction works;
● Operation of aggregate mixing facility; and
● Precast of duct bank and fabrication of steel works.
Contract 3302 Eastern Vehicular Tunnel Advance Works
● Site survey and cable laying; and
● Site establishment.
Contract 3303 Third Runway and Associated Works
● Site establishment.
Third Runway Concourse and Integrated Airport Centres Works:
Contract 3402 New Integrated Airport Centres Enabling Works
● Site establishment;
● Installation of sheet and pipe piles; and
● Manhole and pipe construction works.
Terminal 2 Expansion Works:
Contract 3501 Antenna Farm and Sewage Pumping Station
● Drainage works;
● Boring works; and
● Pipe installation.
Contract 3502 Terminal 2 Automated People Mover (APM) Depot Modification Works
● Site clearance; and
● Painting and fitting out works.
Contract 3503 Terminal 2 Foundation and Substructure Works
● Site establishment;
● Demolition works;
● Utilities, drainage, and road work; and
● Piling and structure works.
Automated People Mover (APM) Works:
Contract 3602 Existing APM System Modification Works
● Site establishment; and
● Modification works at APM depot.
Airport Support Infrastructure & Logistic Works:
Contract 3801 APM and BHS Tunnels on Existing Airport Island
● Site establishment;
● Cofferdam installation and construction of box culvert;
● Rising main installation;
● Drilling and grouting works;
● Piling and foundation works
● Demolition works; and
● Site clearance.
8.2
Key Environmental Issues for the Coming Reporting Period
The key environmental issues for the Project in the coming reporting period expected to be associated with the construction activities include:
● Generation of dust from construction works and stockpiles;
● Noise from operating equipment and machinery on-site;
● Generation of site surface runoffs and wastewater from activities on-site;
● Water quality from DCM works and marine filling;
● DEZ monitoring for ground improvement works (DCM works) and seawall construction;
● Implementation of MMWP for silt curtain deployment;
● Sorting, recycling, storage and disposal of general refuse and construction waste;
● Management of chemicals and avoidance of oil spillage on-site; and
● Acoustic decoupling measures for equipment on marine vessels.
The implementation of required mitigation measures by the contractors will be monitored by the ET.
8.3
Monitoring
Schedule for the Coming Reporting Period
A tentative schedule of the planned environmental monitoring work in the next reporting period is provided in Appendix C.
8.4
Review of the Key Assumptions Adopted in the EIA Report
With reference to Appendix E of the Manual, it is noted that the key assumptions adopted in approved EIA report for the construction phase are still valid and no major changes are involved. The environmental mitigation measures recommended in the approved EIA Report remain applicable and shall be implemented in undertaking construction works for the Project.
9 Conclusion and Recommendation
The key activities of the Project carried out in the reporting period included reclamation works and land-side works. Reclamation works included DCM works, marine filling, seawall construction, and prefabricated vertical drain (PVD) installation. Land-side works involved mainly foundation and substructure work for Terminal 2 expansion, modification and tunnel work for APM and BHS systems, and preparation work for utilities, with activities include site establishment, site office construction, road and drainage works, cable ducting, demolition of existing facilities, piling, and excavation works.
All the monitoring works for construction dust, construction noise, water quality, construction waste, landscape & visual, and CWD were conducted during the reporting period in accordance with the Manual.
Monitoring results of construction dust, construction noise, construction waste, and CWD did not trigger the corresponding Action and Limit Levels during the reporting period.
The water quality monitoring results for turbidity, total alkalinity, SS, and chromium obtained during the reporting period were within the corresponding Action and Limit Levels stipulated in the EM&A programme. Relevant investigation and follow-up actions will be conducted according to the EM&A programme if the corresponding Action and Limit Levels are triggered. For DO and nickel, some testing results triggered the relevant Action or Limit Levels, and the corresponding investigations were conducted accordingly. The investigation findings concluded that the case was not related to the Project. To conclude, the construction activities in the reporting period did not introduce adverse impact to all water quality sensitive receivers.
Weekly site inspections of the construction works were carried out by the ET to audit the implementation of proper environmental pollution control and mitigation measures for the Project. Bi-weekly site inspections were also conducted by the IEC. Site inspection findings were recorded in the site inspection checklists and provided to the contractors to follow up.
On the implementation of the SkyPier Plan, the daily movements of all SkyPier HSFs in June 2019 were in the range of 82 daily movements, which are within the maximum daily cap of 125 daily movements. A total of 630 HSF movements under the SkyPier Plan were recorded in the reporting period. The average speeds of all HSFs travelling through the SCZ ranged from 9.5 to 13.9 knots. All HSFs had travelled through the SCZ with average speeds under 15 knots in compliance with the SkyPier Plan. Two deviations from the diverted route in June 2019 were recorded in the HSF monitoring and are under investigation by the ET. In summary, the ET and IEC have audited the HSF movements against the SkyPier Plan and conducted follow up investigations or actions accordingly.
On the implementation of
MTRMP-CAV, the MSS automatically recorded the deviation case such as speeding, entering
no entry zone and not travelling through the designated gates. ET conducted
checking to ensure the MSS records all deviation cases accurately. Training has
been provided for the concerned skippers to facilitate them in familiarising
with the requirements of the MTRMP-CAV. Deviations including speeding in the
works area, entered no entry zone, and entry from non-designated gates were
reviewed by ET. All the concerned captains were reminded by the contractor’s
MTCC representative to comply with the requirements of the MTRMP-CAV. The ET
reminded contractors that all vessels shall avoid entering the no-entry zone,
in particular the Brothers
Marine Park and the Sha Chau & Lung Kwu Chau Marine Park. Three-month
rolling programmes for construction vessel activities, which ensures the
proposed vessels are necessary and minimal through good planning, were also
received from contractors.